

498
transported material. This information was subsequently used in further FEM analyses. Using
a hyperelastic model for a belt loaded with known forces in FEM allowed simulating the contact zone between the belt and the idler, as well as the interaction forces between these elements in various loading scenarios. The validity of the parameters assumed in the model was
verified by comparing the obtained results of radial loads acting on idlers with the analytical
results based on the theory of bulk solids.
2 PREPARING OF NUMERICAL EXPERIMENTS
The model used in the numerical calculations was a three-roller carrying idler set comprising
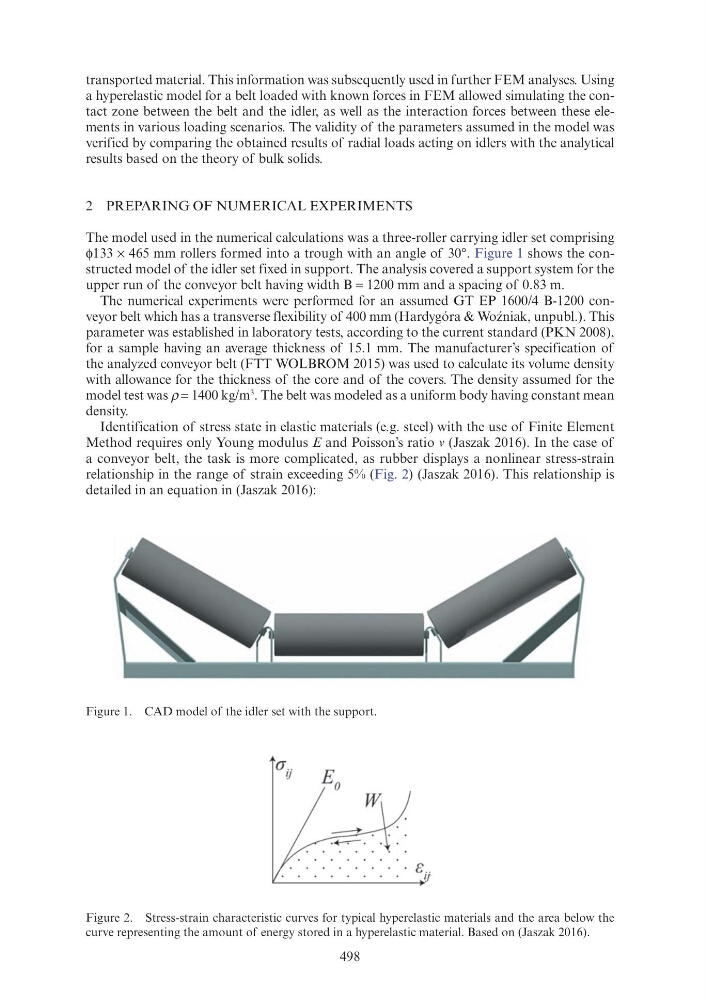
φ133 × 465 mm rollers formed into a trough with an angle of 30°. Figure 1 shows the constructed model of the idler set fixed in support. The analysis covered a support system for the
upper run of the conveyor belt having width B = 1200 mm and a spacing of 0.83 m.
The numerical experiments were performed for an assumed GT EP 1600/4 B-1200 conveyor belt which has a transverse flexibility of 400 mm (Hardygóra & Woźniak, unpubl.). This
parameter was established in laboratory tests, according to the current standard (PKN 2008),
for a sample having an average thickness of 15.1 mm. The manufacturer’s specification of
the analyzed conveyor belt (FTT WOLBROM 2015) was used to calculate its volume density
with allowance for the thickness of the core and of the covers. The density assumed for the
model test was ρ = 1400 kg/m
3
. The belt was modeled as a uniform body having constant mean
density.
Identification of stress state in elastic materials (e.g. steel) with the use of Finite Element
Method requires only Young modulus E and Poisson’s ratio v (Jaszak 2016). In the case of
a conveyor belt, the task is more complicated, as rubber displays a nonlinear stress-strain
relationship in the range of strain exceeding 5% (Fig. 2) (Jaszak 2016). This relationship is
detailed in an equation in (Jaszak 2016):
Figure 1. CAD model of the idler set with the support.
Figure 2. Stress-strain characteristic curves for typical hyperelastic materials and the area below the
curve representing the amount of energy stored in a hyperelastic material. Based on (Jaszak 2016).
transported material. This information was subsequently used in further FEM analyses. Using
a hyperelastic model for a belt loaded with known forces in FEM allowed simulating the contact zone between the belt and the idler, as well as the interaction forces between these elements in various loading scenarios. The validity of the parameters assumed in the model was
verified by comparing the obtained results of radial loads acting on idlers with the analytical
results based on the theory of bulk solids.
2 PREPARING OF NUMERICAL EXPERIMENTS
The model used in the numerical calculations was a three-roller carrying idler set comprising
φ133 × 465 mm rollers formed into a trough with an angle of 30°. Figure 1 shows the constructed model of the idler set fixed in support. The analysis covered a support system for the
upper run of the conveyor belt having width B = 1200 mm and a spacing of 0.83 m.
The numerical experiments were performed for an assumed GT EP 1600/4 B-1200 conveyor belt which has a transverse flexibility of 400 mm (Hardygóra & Woźniak, unpubl.). This
parameter was established in laboratory tests, according to the current standard (PKN 2008),
for a sample having an average thickness of 15.1 mm. The manufacturer’s specification of
the analyzed conveyor belt (FTT WOLBROM 2015) was used to calculate its volume density
with allowance for the thickness of the core and of the covers. The density assumed for the
model test was ρ = 1400 kg/m
3
. The belt was modeled as a uniform body having constant mean
density.
Identification of stress state in elastic materials (e.g. steel) with the use of Finite Element
Method requires only Young modulus E and Poisson’s ratio v (Jaszak 2016). In the case of
a conveyor belt, the task is more complicated, as rubber displays a nonlinear stress-strain
relationship in the range of strain exceeding 5% (Fig. 2) (Jaszak 2016). This relationship is
detailed in an equation in (Jaszak 2016):
Figure 1. CAD model of the idler set with the support.
Figure 2. Stress-strain characteristic curves for typical hyperelastic materials and the area below the
curve representing the amount of energy stored in a hyperelastic material. Based on (Jaszak 2016).