

465
The 49 samples were divided into two datasets: a training set containing 39 samples, where
the model was built, and a test set with 10 samples, where the prediction quality of the neural
network and of the regression model were evaluated.
2.2 Regression analysis
To define which variables compose each regression model it was used the stepwise algorithm
(Hair et al., 2009) considering variable inclusion and exclusion alfa equal to 0.05. For lead
metallurgical recovery no statistically significant model was found, showing that none of the
28 independent variables in the database are able to explain this variable variability through
regression model. All other dependent variables studied presented valid models, once F test
for analyzing model general significance showed a lower p-value than the limit value of 0.05.
This means that at least one of the variables inserted in the model can be considered statistically significant. Analyzing the column “P > |t|” presented in Figure 1 it is possible to
conclude that all independent variables inserted in the models are statistically significant to
explain the variables under study, once all p-values are lower than the significance level determined (0.05).
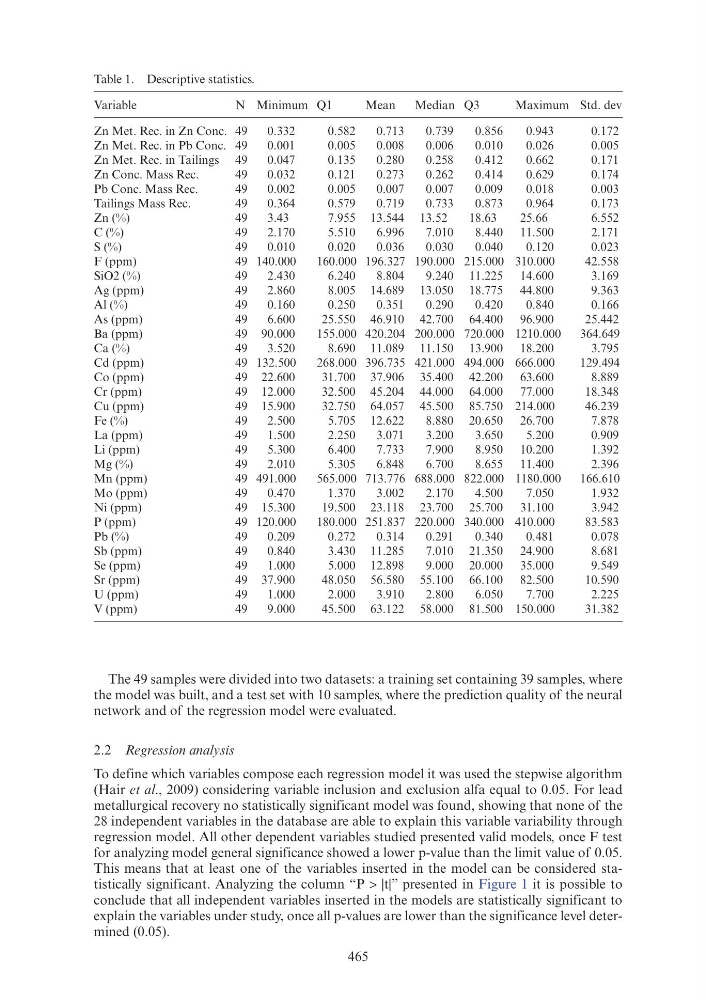
Table 1. Descriptive statistics.
Variable
N Minimum Q1
Mean
Median Q3
Maximum Std. dev
Zn Met. Rec. in Zn Conc. 49
0.332
0.582
0.713
0.739
0.856
0.943
0.172
Zn Met. Rec. in Pb Conc. 49
0.001
0.005
0.008
0.006
0.010
0.026
0.005
Zn Met. Rec. in Tailings 49
0.047
0.135
0.280
0.258
0.412
0.662
0.171
Zn Conc. Mass Rec.
49
0.032
0.121
0.273
0.262
0.414
0.629
0.174
Pb Conc. Mass Rec.
49
0.002
0.005
0.007
0.007
0.009
0.018
0.003
Tailings Mass Rec.
49
0.364
0.579
0.719
0.733
0.873
0.964
0.173
Zn (%)
49
3.43
7.955 13.544 13.52
18.63
25.66
6.552
C (%)
49
2.170
5.510
6.996
7.010
8.440 11.500
2.171
S (%)
49
0.010
0.020
0.036
0.030
0.040
0.120
0.023
F (ppm)
49 140.000
160.000 196.327 190.000 215.000 310.000
42.558
SiO2 (%)
49
2.430
6.240
8.804
9.240 11.225 14.600
3.169
Ag (ppm)
49
2.860
8.005 14.689 13.050 18.775 44.800
9.363
Al (%)
49
0.160
0.250
0.351
0.290
0.420
0.840
0.166
As (ppm)
49
6.600
25.550 46.910 42.700 64.400 96.900
25.442
Ba (ppm)
49 90.000
155.000 420.204 200.000 720.000 1210.000
364.649
Ca (%)
49
3.520
8.690 11.089 11.150 13.900 18.200
3.795
Cd (ppm)
49 132.500
268.000 396.735 421.000 494.000 666.000
129.494
Co (ppm)
49 22.600
31.700 37.906 35.400 42.200 63.600
8.889
Cr (ppm)
49 12.000
32.500 45.204 44.000 64.000 77.000
18.348
Cu (ppm)
49 15.900
32.750 64.057 45.500 85.750 214.000
46.239
Fe (%)
49
2.500
5.705 12.622
8.880 20.650 26.700
7.878
La (ppm)
49
1.500
2.250
3.071
3.200
3.650
5.200
0.909
Li (ppm)
49
5.300
6.400
7.733
7.900
8.950 10.200
1.392
Mg (%)
49
2.010
5.305
6.848
6.700
8.655 11.400
2.396
Mn (ppm)
49 491.000
565.000 713.776 688.000 822.000 1180.000
166.610
Mo (ppm)
49
0.470
1.370
3.002
2.170
4.500
7.050
1.932
Ni (ppm)
49 15.300
19.500 23.118 23.700 25.700 31.100
3.942
P (ppm)
49 120.000
180.000 251.837 220.000 340.000 410.000
83.583
Pb (%)
49
0.209
0.272
0.314
0.291
0.340
0.481
0.078
Sb (ppm)
49
0.840
3.430 11.285
7.010 21.350 24.900
8.681
Se (ppm)
49
1.000
5.000 12.898
9.000 20.000 35.000
9.549
Sr (ppm)
49 37.900
48.050 56.580 55.100 66.100 82.500
10.590
U (ppm)
49
1.000
2.000
3.910
2.800
6.050
7.700
2.225
V (ppm)
49
9.000
45.500 63.122 58.000 81.500 150.000
31.382
The 49 samples were divided into two datasets: a training set containing 39 samples, where
the model was built, and a test set with 10 samples, where the prediction quality of the neural
network and of the regression model were evaluated.
2.2 Regression analysis
To define which variables compose each regression model it was used the stepwise algorithm
(Hair et al., 2009) considering variable inclusion and exclusion alfa equal to 0.05. For lead
metallurgical recovery no statistically significant model was found, showing that none of the
28 independent variables in the database are able to explain this variable variability through
regression model. All other dependent variables studied presented valid models, once F test
for analyzing model general significance showed a lower p-value than the limit value of 0.05.
This means that at least one of the variables inserted in the model can be considered statistically significant. Analyzing the column “P > |t|” presented in Figure 1 it is possible to
conclude that all independent variables inserted in the models are statistically significant to
explain the variables under study, once all p-values are lower than the significance level determined (0.05).
Table 1. Descriptive statistics.
Variable
N Minimum Q1
Mean
Median Q3
Maximum Std. dev
Zn Met. Rec. in Zn Conc. 49
0.332
0.582
0.713
0.739
0.856
0.943
0.172
Zn Met. Rec. in Pb Conc. 49
0.001
0.005
0.008
0.006
0.010
0.026
0.005
Zn Met. Rec. in Tailings 49
0.047
0.135
0.280
0.258
0.412
0.662
0.171
Zn Conc. Mass Rec.
49
0.032
0.121
0.273
0.262
0.414
0.629
0.174
Pb Conc. Mass Rec.
49
0.002
0.005
0.007
0.007
0.009
0.018
0.003
Tailings Mass Rec.
49
0.364
0.579
0.719
0.733
0.873
0.964
0.173
Zn (%)
49
3.43
7.955 13.544 13.52
18.63
25.66
6.552
C (%)
49
2.170
5.510
6.996
7.010
8.440 11.500
2.171
S (%)
49
0.010
0.020
0.036
0.030
0.040
0.120
0.023
F (ppm)
49 140.000
160.000 196.327 190.000 215.000 310.000
42.558
SiO2 (%)
49
2.430
6.240
8.804
9.240 11.225 14.600
3.169
Ag (ppm)
49
2.860
8.005 14.689 13.050 18.775 44.800
9.363
Al (%)
49
0.160
0.250
0.351
0.290
0.420
0.840
0.166
As (ppm)
49
6.600
25.550 46.910 42.700 64.400 96.900
25.442
Ba (ppm)
49 90.000
155.000 420.204 200.000 720.000 1210.000
364.649
Ca (%)
49
3.520
8.690 11.089 11.150 13.900 18.200
3.795
Cd (ppm)
49 132.500
268.000 396.735 421.000 494.000 666.000
129.494
Co (ppm)
49 22.600
31.700 37.906 35.400 42.200 63.600
8.889
Cr (ppm)
49 12.000
32.500 45.204 44.000 64.000 77.000
18.348
Cu (ppm)
49 15.900
32.750 64.057 45.500 85.750 214.000
46.239
Fe (%)
49
2.500
5.705 12.622
8.880 20.650 26.700
7.878
La (ppm)
49
1.500
2.250
3.071
3.200
3.650
5.200
0.909
Li (ppm)
49
5.300
6.400
7.733
7.900
8.950 10.200
1.392
Mg (%)
49
2.010
5.305
6.848
6.700
8.655 11.400
2.396
Mn (ppm)
49 491.000
565.000 713.776 688.000 822.000 1180.000
166.610
Mo (ppm)
49
0.470
1.370
3.002
2.170
4.500
7.050
1.932
Ni (ppm)
49 15.300
19.500 23.118 23.700 25.700 31.100
3.942
P (ppm)
49 120.000
180.000 251.837 220.000 340.000 410.000
83.583
Pb (%)
49
0.209
0.272
0.314
0.291
0.340
0.481
0.078
Sb (ppm)
49
0.840
3.430 11.285
7.010 21.350 24.900
8.681
Se (ppm)
49
1.000
5.000 12.898
9.000 20.000 35.000
9.549
Sr (ppm)
49 37.900
48.050 56.580 55.100 66.100 82.500
10.590
U (ppm)
49
1.000
2.000
3.910
2.800
6.050
7.700
2.225
V (ppm)
49
9.000
45.500 63.122 58.000 81.500 150.000
31.382