

460
machine vision system for prediction of quality of iron ores. The iron ore samples were collected from mine using a stratified random sampling method. The samples are collected from
the different part of the mine to represent the heterogeneity of the geology present in the
specific mine. The images of the iron ore samples are captured in the laboratory by fabricating a pilot conveyor belt transportation system. A total of 53 image samples were captured
for the training and testing of the deep network. The grade values of the iron ore samples are
estimated using XRF analyzer correspond to each image sample. The grade values (Fe 2 O 3 %)
of the samples are ranged from 19.35% to 97.36%. A wide variation in the grades of iron ores
indicates that the quality of ore are varied in the different part of the mine and thus a proper
quality monitoring system in the mine is desired.
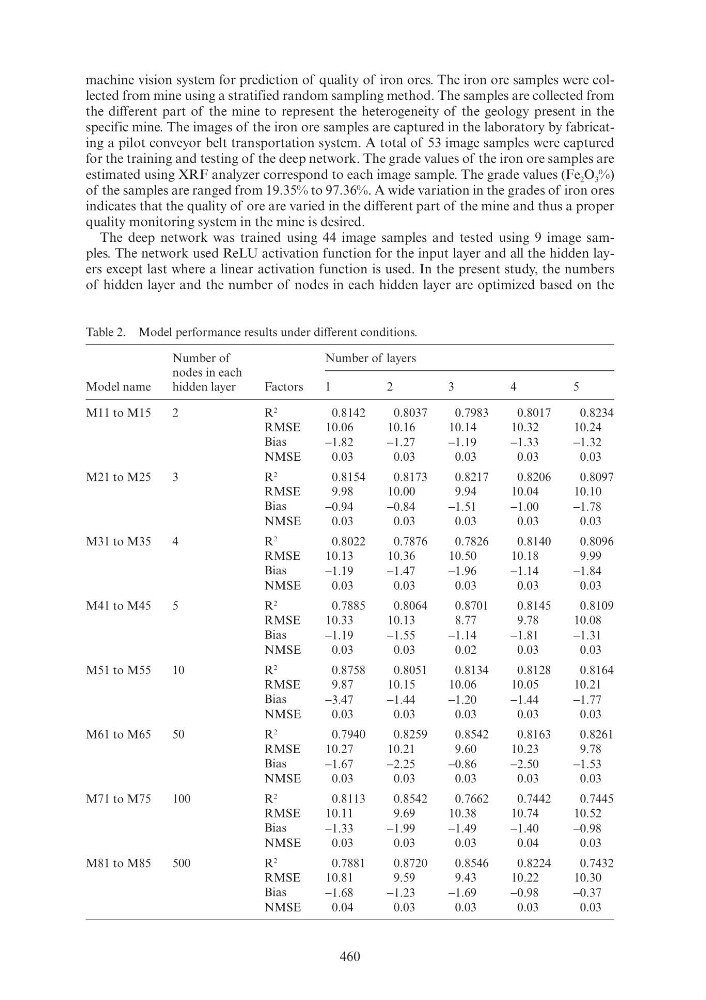
The deep network was trained using 44 image samples and tested using 9 image samples. The network used ReLU activation function for the input layer and all the hidden layers except last where a linear activation function is used. In the present study, the numbers
of hidden layer and the number of nodes in each hidden layer are optimized based on the
Table 2. Model performance results under different conditions.
Model name
Number of
nodes in each
hidden layer
Factors
Number of layers
1
2
3
4
5
M11 to M15
2
R
2
0.8142
0.8037
0.7983
0.8017
0.8234
RMSE
10.06
10.16
10.14
10.32
10.24
Bias
−1.82
−1.27
−1.19
−1.33
−1.32
NMSE
0.03
0.03
0.03
0.03
0.03
M21 to M25
3
R
2
0.8154
0.8173
0.8217
0.8206
0.8097
RMSE
9.98
10.00
9.94
10.04
10.10
Bias
−0.94
−0.84
−1.51
−1.00
−1.78
NMSE
0.03
0.03
0.03
0.03
0.03
M31 to M35
4
R
2
0.8022
0.7876
0.7826
0.8140
0.8096
RMSE
10.13
10.36
10.50
10.18
9.99
Bias
−1.19
−1.47
−1.96
−1.14
−1.84
NMSE
0.03
0.03
0.03
0.03
0.03
M41 to M45
5
R
2
0.7885
0.8064
0.8701
0.8145
0.8109
RMSE
10.33
10.13
8.77
9.78
10.08
Bias
−1.19
−1.55
−1.14
−1.81
−1.31
NMSE
0.03
0.03
0.02
0.03
0.03
M51 to M55
10
R
2
0.8758
0.8051
0.8134
0.8128
0.8164
RMSE
9.87
10.15
10.06
10.05
10.21
Bias
−3.47
−1.44
−1.20
−1.44
−1.77
NMSE
0.03
0.03
0.03
0.03
0.03
M61 to M65
50
R
2
0.7940
0.8259
0.8542
0.8163
0.8261
RMSE
10.27
10.21
9.60
10.23
9.78
Bias
−1.67
−2.25
−0.86
−2.50
−1.53
NMSE
0.03
0.03
0.03
0.03
0.03
M71 to M75
100
R
2
0.8113
0.8542
0.7662
0.7442
0.7445
RMSE
10.11
9.69
10.38
10.74
10.52
Bias
−1.33
−1.99
−1.49
−1.40
−0.98
NMSE
0.03
0.03
0.03
0.04
0.03
M81 to M85
500
R
2
0.7881
0.8720
0.8546
0.8224
0.7432
RMSE
10.81
9.59
9.43
10.22
10.30
Bias
−1.68
−1.23
−1.69
−0.98
−0.37
NMSE
0.04
0.03
0.03
0.03
0.03
machine vision system for prediction of quality of iron ores. The iron ore samples were collected from mine using a stratified random sampling method. The samples are collected from
the different part of the mine to represent the heterogeneity of the geology present in the
specific mine. The images of the iron ore samples are captured in the laboratory by fabricating a pilot conveyor belt transportation system. A total of 53 image samples were captured
for the training and testing of the deep network. The grade values of the iron ore samples are
estimated using XRF analyzer correspond to each image sample. The grade values (Fe 2 O 3 %)
of the samples are ranged from 19.35% to 97.36%. A wide variation in the grades of iron ores
indicates that the quality of ore are varied in the different part of the mine and thus a proper
quality monitoring system in the mine is desired.
The deep network was trained using 44 image samples and tested using 9 image samples. The network used ReLU activation function for the input layer and all the hidden layers except last where a linear activation function is used. In the present study, the numbers
of hidden layer and the number of nodes in each hidden layer are optimized based on the
Table 2. Model performance results under different conditions.
Model name
Number of
nodes in each
hidden layer
Factors
Number of layers
1
2
3
4
5
M11 to M15
2
R
2
0.8142
0.8037
0.7983
0.8017
0.8234
RMSE
10.06
10.16
10.14
10.32
10.24
Bias
−1.82
−1.27
−1.19
−1.33
−1.32
NMSE
0.03
0.03
0.03
0.03
0.03
M21 to M25
3
R
2
0.8154
0.8173
0.8217
0.8206
0.8097
RMSE
9.98
10.00
9.94
10.04
10.10
Bias
−0.94
−0.84
−1.51
−1.00
−1.78
NMSE
0.03
0.03
0.03
0.03
0.03
M31 to M35
4
R
2
0.8022
0.7876
0.7826
0.8140
0.8096
RMSE
10.13
10.36
10.50
10.18
9.99
Bias
−1.19
−1.47
−1.96
−1.14
−1.84
NMSE
0.03
0.03
0.03
0.03
0.03
M41 to M45
5
R
2
0.7885
0.8064
0.8701
0.8145
0.8109
RMSE
10.33
10.13
8.77
9.78
10.08
Bias
−1.19
−1.55
−1.14
−1.81
−1.31
NMSE
0.03
0.03
0.02
0.03
0.03
M51 to M55
10
R
2
0.8758
0.8051
0.8134
0.8128
0.8164
RMSE
9.87
10.15
10.06
10.05
10.21
Bias
−3.47
−1.44
−1.20
−1.44
−1.77
NMSE
0.03
0.03
0.03
0.03
0.03
M61 to M65
50
R
2
0.7940
0.8259
0.8542
0.8163
0.8261
RMSE
10.27
10.21
9.60
10.23
9.78
Bias
−1.67
−2.25
−0.86
−2.50
−1.53
NMSE
0.03
0.03
0.03
0.03
0.03
M71 to M75
100
R
2
0.8113
0.8542
0.7662
0.7442
0.7445
RMSE
10.11
9.69
10.38
10.74
10.52
Bias
−1.33
−1.99
−1.49
−1.40
−0.98
NMSE
0.03
0.03
0.03
0.04
0.03
M81 to M85
500
R
2
0.7881
0.8720
0.8546
0.8224
0.7432
RMSE
10.81
9.59
9.43
10.22
10.30
Bias
−1.68
−1.23
−1.69
−0.98
−0.37
NMSE
0.04
0.03
0.03
0.03
0.03