

434
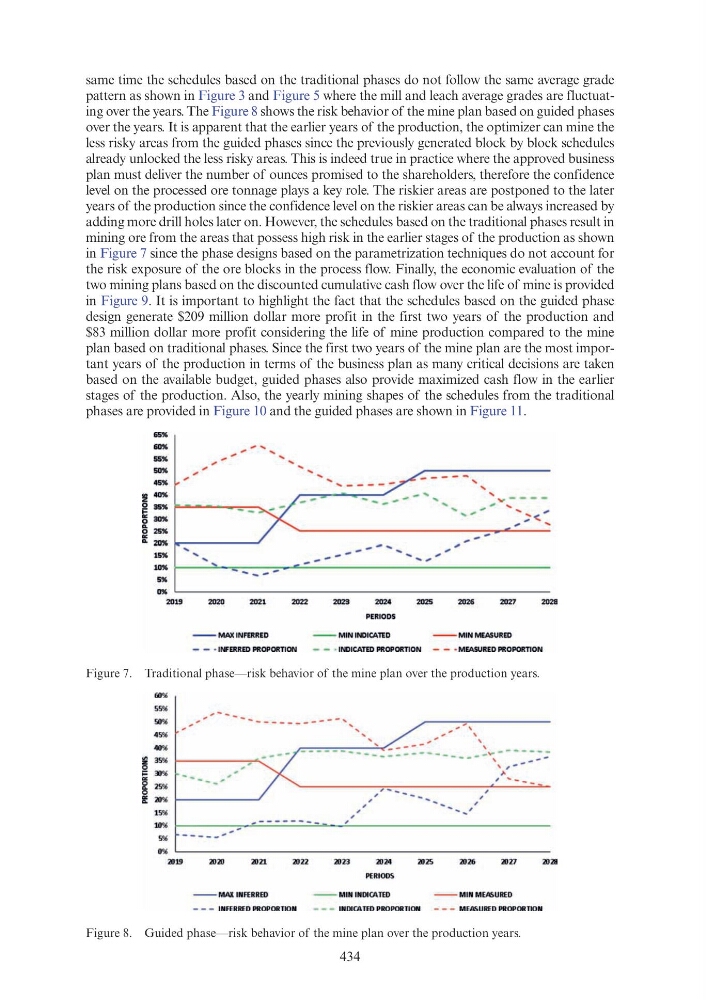
Figure 7. Traditional phase—risk behavior of the mine plan over the production years.
same time the schedules based on the traditional phases do not follow the same average grade
pattern as shown in Figure 3 and Figure 5 where the mill and leach average grades are fluctuating over the years. The Figure 8 shows the risk behavior of the mine plan based on guided phases
over the years. It is apparent that the earlier years of the production, the optimizer can mine the
less risky areas from the guided phases since the previously generated block by block schedules
already unlocked the less risky areas. This is indeed true in practice where the approved business
plan must deliver the number of ounces promised to the shareholders, therefore the confidence
level on the processed ore tonnage plays a key role. The riskier areas are postponed to the later
years of the production since the confidence level on the riskier areas can be always increased by
adding more drill holes later on. However, the schedules based on the traditional phases result in
mining ore from the areas that possess high risk in the earlier stages of the production as shown
in Figure 7 since the phase designs based on the parametrization techniques do not account for
the risk exposure of the ore blocks in the process flow. Finally, the economic evaluation of the
two mining plans based on the discounted cumulative cash flow over the life of mine is provided
in Figure 9. It is important to highlight the fact that the schedules based on the guided phase
design generate $209 million dollar more profit in the first two years of the production and
$83 million dollar more profit considering the life of mine production compared to the mine
plan based on traditional phases. Since the first two years of the mine plan are the most important years of the production in terms of the business plan as many critical decisions are taken
based on the available budget, guided phases also provide maximized cash flow in the earlier
stages of the production. Also, the yearly mining shapes of the schedules from the traditional
phases are provided in Figure 10 and the guided phases are shown in Figure 11.
Figure 8. Guided phase—risk behavior of the mine plan over the production years.
:1!
0
!;;
0
..
~
65%
60%
55%
50%
45%
40%
35%
30%
25%
20%
15%
10%
5%
0%
2019
40'!.1
3~~
:I) '!
a! '!
10'!.1
~'!<\
0'!.1
all9
......
"
...
"
, _____ ----'""", ...
_ ...
...
--..... ---... ...
......
... ...
:;<.
--___ ...
2020
2021
2022
2023
2024
2025
2026
2027
2028
PERIODS
- - MAX INFERRED
- - MIN INDICATED
- - MIN MEASURED
- - · INFERRED PROPORTION
- - • INDICATED PROPORTION
- - · MEASURED PROPORTION
.... --- -------------. .....
~ '
,
' ' ' '
--,
,
,
, __
'
-
----- ,
' ' '
- -~ ---- :;=
' , -,
'
Jo,
' '- --... -------- ,
ala!
al21
al22
- - MAX INFERRED
- - - INFERRED PROPORTION
al24
PERIODS
al26
al27
al28
- - MIN INDICATED
- - MIN MEASURED
- - - INDIOHED PROPORTION
- - - MEASURED PROPORTION
Figure 7. Traditional phase—risk behavior of the mine plan over the production years.
same time the schedules based on the traditional phases do not follow the same average grade
pattern as shown in Figure 3 and Figure 5 where the mill and leach average grades are fluctuating over the years. The Figure 8 shows the risk behavior of the mine plan based on guided phases
over the years. It is apparent that the earlier years of the production, the optimizer can mine the
less risky areas from the guided phases since the previously generated block by block schedules
already unlocked the less risky areas. This is indeed true in practice where the approved business
plan must deliver the number of ounces promised to the shareholders, therefore the confidence
level on the processed ore tonnage plays a key role. The riskier areas are postponed to the later
years of the production since the confidence level on the riskier areas can be always increased by
adding more drill holes later on. However, the schedules based on the traditional phases result in
mining ore from the areas that possess high risk in the earlier stages of the production as shown
in Figure 7 since the phase designs based on the parametrization techniques do not account for
the risk exposure of the ore blocks in the process flow. Finally, the economic evaluation of the
two mining plans based on the discounted cumulative cash flow over the life of mine is provided
in Figure 9. It is important to highlight the fact that the schedules based on the guided phase
design generate $209 million dollar more profit in the first two years of the production and
$83 million dollar more profit considering the life of mine production compared to the mine
plan based on traditional phases. Since the first two years of the mine plan are the most important years of the production in terms of the business plan as many critical decisions are taken
based on the available budget, guided phases also provide maximized cash flow in the earlier
stages of the production. Also, the yearly mining shapes of the schedules from the traditional
phases are provided in Figure 10 and the guided phases are shown in Figure 11.
Figure 8. Guided phase—risk behavior of the mine plan over the production years.
:1!
0
!;;
0
..
~
65%
60%
55%
50%
45%
40%
35%
30%
25%
20%
15%
10%
5%
0%
2019
40'!.1
3~~
:I) '!
a! '!
10'!.1
~'!<\
0'!.1
all9
......
"
...
"
, _____ ----'""", ...
_ ...
...
--..... ---... ...
......
... ...
:;<.
--___ ...
2020
2021
2022
2023
2024
2025
2026
2027
2028
PERIODS
- - MAX INFERRED
- - MIN INDICATED
- - MIN MEASURED
- - · INFERRED PROPORTION
- - • INDICATED PROPORTION
- - · MEASURED PROPORTION
.... --- -------------. .....
~ '
,
' ' ' '
--,
,
,
, __
'
-
----- ,
' ' '
- -~ ---- :;=
' , -,
'
Jo,
' '- --... -------- ,
ala!
al21
al22
- - MAX INFERRED
- - - INFERRED PROPORTION
al24
PERIODS
al26
al27
al28
- - MIN INDICATED
- - MIN MEASURED
- - - INDIOHED PROPORTION
- - - MEASURED PROPORTION