

391
4 RESULTS
Satisfactory results were achieved for the case study: the optimized schedule could achieve
6145 oz while the manual schedule 5039 oz.
It is always hard to compare manual and optimized results, since the manual depends on
the experience of the planning engineer and may differ from the scheduling algorithm used
(here (production)/(total duration) ratio).
Optimization processing time was 72 seconds. While this may increase with greater number
of tasks and activities (roughly the number of constraints increases with the square of number
of tasks) reasonable solving time is expected for practical problems.
5 CONCLUSIONS
Standardizing and automatizing the process increases the flexibility needed to face mine
dynamics while always pointing to the best resource allocation, thereby making it easier to
create schedule scenarios (for different possible inputs) and having a prioritized task list
always updated.
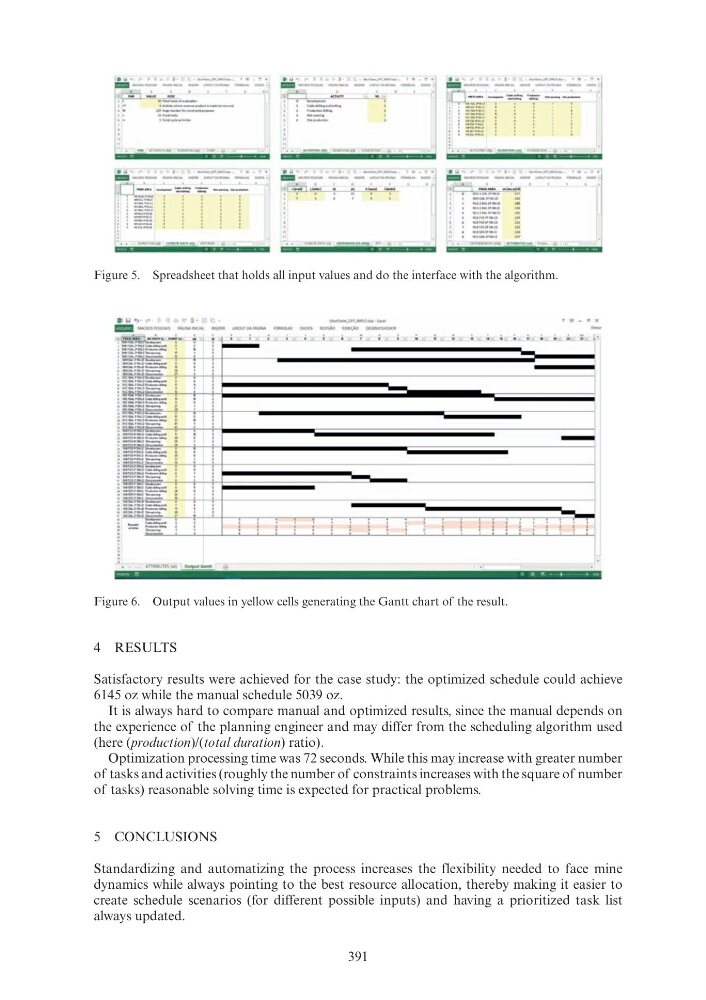
Figure 5. Spreadsheet that holds all input values and do the interface with the algorithm.
Figure 6. Output values in yellow cells generating the Gantt chart of the result.
• g ., (>
• ·
tl . --..-....--- 1 ., - r' "
1:111 _.._ - -
.-oo- _...,
;¢ _
0
J
eo. .... --...
. ", . . .. . . --- .. -, .I
- - - - - .__.00_-..... - ·
I
'
I
I
'
t
•
•
---· -
<::::.:: "'::::' - - - -
'
•• ·- ~:>U
o
'
o
•
'
--·-· . . ' .
. -.... k'"'"'
•
•
'
-... -..... .
. . '
... ....... .
. . .
..... ~.....
. .
..........
. .
.. _,... . .
. '
··-~....
. .
.. -~.....
. .
, .
too!o,.llO"f't .,...........,..loYIII An
4 RESULTS
Satisfactory results were achieved for the case study: the optimized schedule could achieve
6145 oz while the manual schedule 5039 oz.
It is always hard to compare manual and optimized results, since the manual depends on
the experience of the planning engineer and may differ from the scheduling algorithm used
(here (production)/(total duration) ratio).
Optimization processing time was 72 seconds. While this may increase with greater number
of tasks and activities (roughly the number of constraints increases with the square of number
of tasks) reasonable solving time is expected for practical problems.
5 CONCLUSIONS
Standardizing and automatizing the process increases the flexibility needed to face mine
dynamics while always pointing to the best resource allocation, thereby making it easier to
create schedule scenarios (for different possible inputs) and having a prioritized task list
always updated.
Figure 5. Spreadsheet that holds all input values and do the interface with the algorithm.
Figure 6. Output values in yellow cells generating the Gantt chart of the result.
• g ., (>
• ·
tl . --..-....--- 1 ., - r' "
1:111 _.._ - -
.-oo- _...,
;¢ _
0
J
eo. .... --...
. ", . . .. . . --- .. -, .I
- - - - - .__.00_-..... - ·
I
'
I
I
'
t
•
•
---· -
<::::.:: "'::::' - - - -
'
•• ·- ~:>U
o
'
o
•
'
--·-· . . ' .
. -.... k'"'"'
•
•
'
-... -..... .
. . '
... ....... .
. . .
..... ~.....
. .
..........
. .
.. _,... . .
. '
··-~....
. .
.. -~.....
. .
, .
too!o,.llO"f't .,...........,..loYIII An