

337
2 UNDERGROUND MINE PLANNING PROCESS
As shown in Figure 1, the project study process involves resource evaluation, mine planning
and economic analysis.
2.1 Resource estimation and grade uncertainty analysis
Resource modeling is the foundation of mine planning and project economics evaluation.
To reduce the risks from the beginning of the process, one needs to understand the resource
uncertainties, including risks and opportunities. Conditional simulation has been proven useful to evaluate the resource model. 100 simulation models were created to check the resource
model. Simulations of the Au grade were generated using the Turning Bands method. For
more details, please refer to a paper published at APCOM 2015
[3]
. 50 of the 100 simulation
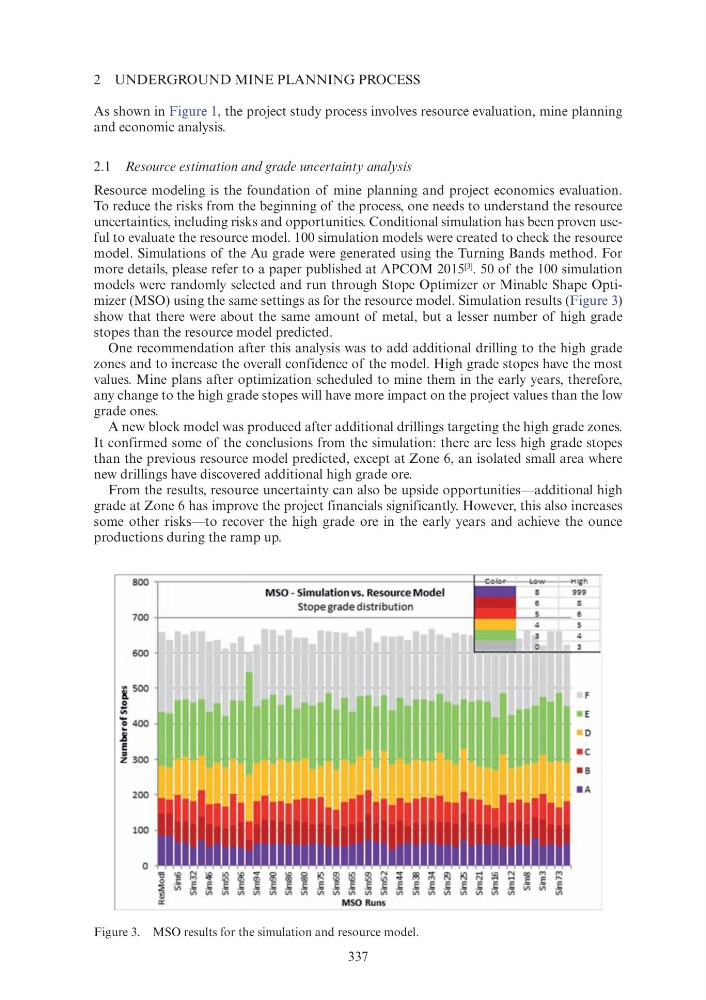
models were randomly selected and run through Stope Optimizer or Minable Shape Optimizer (MSO) using the same settings as for the resource model. Simulation results (Figure 3)
show that there were about the same amount of metal, but a lesser number of high grade
stopes than the resource model predicted.
One recommendation after this analysis was to add additional drilling to the high grade
zones and to increase the overall confidence of the model. High grade stopes have the most
values. Mine plans after optimization scheduled to mine them in the early years, therefore,
any change to the high grade stopes will have more impact on the project values than the low
grade ones.
A new block model was produced after additional drillings targeting the high grade zones.
It confirmed some of the conclusions from the simulation: there are less high grade stopes
than the previous resource model predicted, except at Zone 6, an isolated small area where
new drillings have discovered additional high grade ore.
From the results, resource uncertainty can also be upside opportunities—additional high
grade at Zone 6 has improve the project financials significantly. However, this also increases
some other risks—to recover the high grade ore in the early years and achieve the ounce
productions during the ramp up.
Figure 3. MSO results for the simulation and resource model.
800
MSO - Simulation vs. Resource Model
Stope grade distribution
700
600
8. 500
~
"'
• e
...
~ 400
D
..!!
E
• c
"
Z 300
• s
200
100
0
Vl
Vl
Vl
Vl
Vl
MSO Runs
2 UNDERGROUND MINE PLANNING PROCESS
As shown in Figure 1, the project study process involves resource evaluation, mine planning
and economic analysis.
2.1 Resource estimation and grade uncertainty analysis
Resource modeling is the foundation of mine planning and project economics evaluation.
To reduce the risks from the beginning of the process, one needs to understand the resource
uncertainties, including risks and opportunities. Conditional simulation has been proven useful to evaluate the resource model. 100 simulation models were created to check the resource
model. Simulations of the Au grade were generated using the Turning Bands method. For
more details, please refer to a paper published at APCOM 2015
[3]
. 50 of the 100 simulation
models were randomly selected and run through Stope Optimizer or Minable Shape Optimizer (MSO) using the same settings as for the resource model. Simulation results (Figure 3)
show that there were about the same amount of metal, but a lesser number of high grade
stopes than the resource model predicted.
One recommendation after this analysis was to add additional drilling to the high grade
zones and to increase the overall confidence of the model. High grade stopes have the most
values. Mine plans after optimization scheduled to mine them in the early years, therefore,
any change to the high grade stopes will have more impact on the project values than the low
grade ones.
A new block model was produced after additional drillings targeting the high grade zones.
It confirmed some of the conclusions from the simulation: there are less high grade stopes
than the previous resource model predicted, except at Zone 6, an isolated small area where
new drillings have discovered additional high grade ore.
From the results, resource uncertainty can also be upside opportunities—additional high
grade at Zone 6 has improve the project financials significantly. However, this also increases
some other risks—to recover the high grade ore in the early years and achieve the ounce
productions during the ramp up.
Figure 3. MSO results for the simulation and resource model.
800
MSO - Simulation vs. Resource Model
Stope grade distribution
700
600
8. 500
~
"'
• e
...
~ 400
D
..!!
E
• c
"
Z 300
• s
200
100
0
Vl
Vl
Vl
Vl
Vl
MSO Runs