

331
Table 2. List of processing stream options.
Processing stream
Processing cost ($/ton)
Copper recovery (%)
Gold recovery (%)
1
30
54
48
2
40.8
62
53
3
48
68
57
4
55.2
74
63
5
60
79
66
6
67.2
83
71
7
72
85
72
8
74.4
86
73
9
81.6
87
75
10
91.2
88
77
11
100.8
89
78
Table 3. List of profitability parameters.
Parameter
Representation
Unit
M
Cost of constructing a processing stream
$50M
P copper
Price of copper per ton
$5894
P gold
Price of gold per gram
$41
m c
Mining cost per ton
$50
c
Magnitude of penalization
50
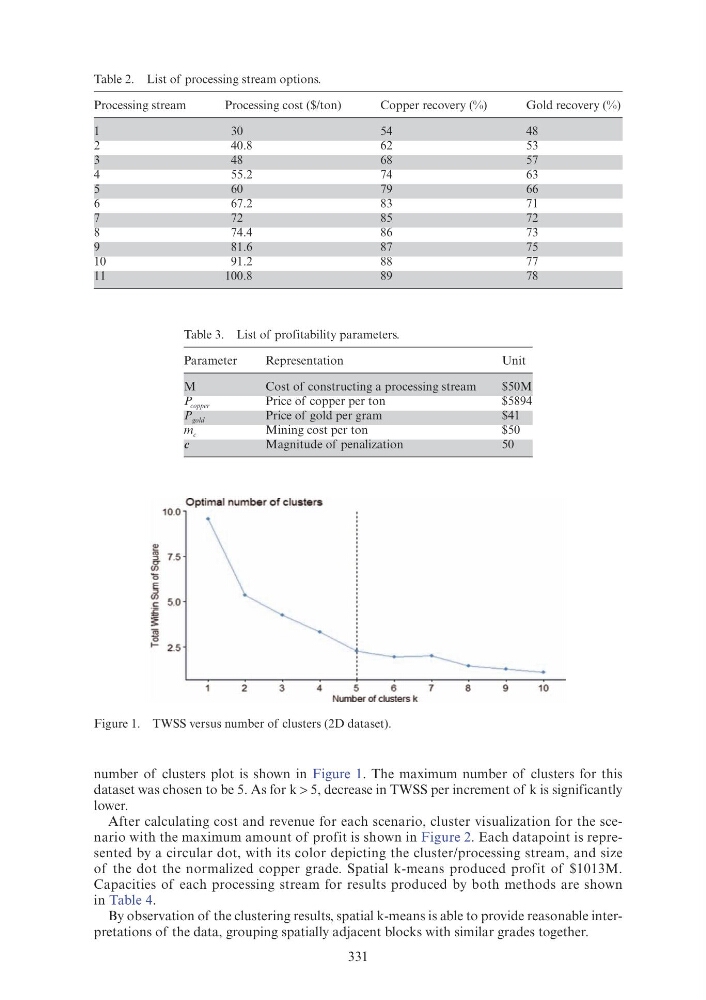
Figure 1. TWSS versus number of clusters (2D dataset).
number of clusters plot is shown in Figure 1. The maximum number of clusters for this
dataset was chosen to be 5. As for k > 5, decrease in TWSS per increment of k is significantly
lower.
After calculating cost and revenue for each scenario, cluster visualization for the scenario with the maximum amount of profit is shown in Figure 2. Each datapoint is represented by a circular dot, with its color depicting the cluster/processing stream, and size
of the dot the normalized copper grade. Spatial k-means produced profit of $1013M.
Capacities of each processing stream for results produced by both methods are shown
in Table 4.
By observation of the clustering results, spatial k-means is able to provide reasonable interpretations of the data, grouping spatially adjacent blocks with similar grades together.
10.0
!"
~ 7 _5
0
E
::>
~ 5.0
£
:?::
ro
15
r- 2.5
Optimal number of clusters
2
3
4
5
6
7
8
9
10
Number of clusters k
Table 2. List of processing stream options.
Processing stream
Processing cost ($/ton)
Copper recovery (%)
Gold recovery (%)
1
30
54
48
2
40.8
62
53
3
48
68
57
4
55.2
74
63
5
60
79
66
6
67.2
83
71
7
72
85
72
8
74.4
86
73
9
81.6
87
75
10
91.2
88
77
11
100.8
89
78
Table 3. List of profitability parameters.
Parameter
Representation
Unit
M
Cost of constructing a processing stream
$50M
P copper
Price of copper per ton
$5894
P gold
Price of gold per gram
$41
m c
Mining cost per ton
$50
c
Magnitude of penalization
50
Figure 1. TWSS versus number of clusters (2D dataset).
number of clusters plot is shown in Figure 1. The maximum number of clusters for this
dataset was chosen to be 5. As for k > 5, decrease in TWSS per increment of k is significantly
lower.
After calculating cost and revenue for each scenario, cluster visualization for the scenario with the maximum amount of profit is shown in Figure 2. Each datapoint is represented by a circular dot, with its color depicting the cluster/processing stream, and size
of the dot the normalized copper grade. Spatial k-means produced profit of $1013M.
Capacities of each processing stream for results produced by both methods are shown
in Table 4.
By observation of the clustering results, spatial k-means is able to provide reasonable interpretations of the data, grouping spatially adjacent blocks with similar grades together.
10.0
!"
~ 7 _5
0
E
::>
~ 5.0
£
:?::
ro
15
r- 2.5
Optimal number of clusters
2
3
4
5
6
7
8
9
10
Number of clusters k