

317
estimated in terms of the uncertainty it generates over the output by subtracting each one of
the input variables. Thus we can estimate how much information is gained for each feature
used as part of the model’s experimental design, and how much information is lost when the
respective feature is not present in the model (Kullback & Leibler, 1951).
For this purpose, the amount of information gain is calculated considering the ensemble
structure and the average depth at which different features fed to the model can be found
across the whole set of trees that the algorithm used as weak learners. High importance
attributes are usually found near the roots of the binary decision trees, and their information
gain values regarding the output can be ordered in a column chart.
6 MODEL RESULTS
The information sets previously described and the features which characterize them, define
the training data for a tree-based gradient boosting algorithm called “Extreme Gradient
Boosting” (Chen & Guestrin, 2016). The goal of this algorithm is to build a model that optimally captures the interdependence among these variables and the output, thus developing an
information classifier that allows us to convey the vulnerability to collapse damage in a production level’s support pillars into a probability
4
, henceforth being called Pillar Vulnerability
Index (PVI).
6.1 General indicators
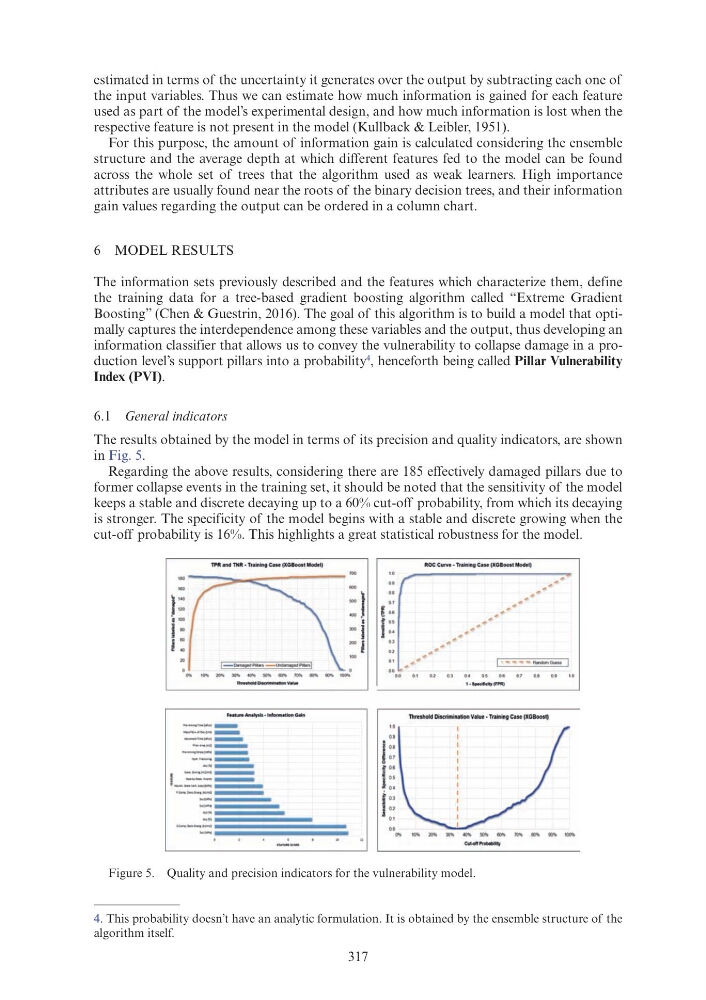
The results obtained by the model in terms of its precision and quality indicators, are shown
in Fig. 5.
Regarding the above results, considering there are 185 effectively damaged pillars due to
former collapse events in the training set, it should be noted that the sensitivity of the model
keeps a stable and discrete decaying up to a 60% cut-off probability, from which its decaying
is stronger. The specificity of the model begins with a stable and discrete growing when the
cut-off probability is 16%. This highlights a great statistical robustness for the model.
Figure 5. Quality and precision indicators for the vulnerability model.
4. This probability doesn’t have an analytic formulation. It is obtained by the ensemble structure of the
algorithm itself.
TPR and TNR ·Training Case {XGBoost Model)
Future Analysls -lnformadonGaln
- .. - 1,.1 -
............... ~
--..,- .. ,,.~1""1 -
_ ,,. ..... _
"''1 .. _
ROC Curve · Training Case (XGBoost Model)
Threshold Oiscrimin tion Valut · Training Case (XGBoost)
Cu!-oti'ProbltMiity
estimated in terms of the uncertainty it generates over the output by subtracting each one of
the input variables. Thus we can estimate how much information is gained for each feature
used as part of the model’s experimental design, and how much information is lost when the
respective feature is not present in the model (Kullback & Leibler, 1951).
For this purpose, the amount of information gain is calculated considering the ensemble
structure and the average depth at which different features fed to the model can be found
across the whole set of trees that the algorithm used as weak learners. High importance
attributes are usually found near the roots of the binary decision trees, and their information
gain values regarding the output can be ordered in a column chart.
6 MODEL RESULTS
The information sets previously described and the features which characterize them, define
the training data for a tree-based gradient boosting algorithm called “Extreme Gradient
Boosting” (Chen & Guestrin, 2016). The goal of this algorithm is to build a model that optimally captures the interdependence among these variables and the output, thus developing an
information classifier that allows us to convey the vulnerability to collapse damage in a production level’s support pillars into a probability
4
, henceforth being called Pillar Vulnerability
Index (PVI).
6.1 General indicators
The results obtained by the model in terms of its precision and quality indicators, are shown
in Fig. 5.
Regarding the above results, considering there are 185 effectively damaged pillars due to
former collapse events in the training set, it should be noted that the sensitivity of the model
keeps a stable and discrete decaying up to a 60% cut-off probability, from which its decaying
is stronger. The specificity of the model begins with a stable and discrete growing when the
cut-off probability is 16%. This highlights a great statistical robustness for the model.
Figure 5. Quality and precision indicators for the vulnerability model.
4. This probability doesn’t have an analytic formulation. It is obtained by the ensemble structure of the
algorithm itself.
TPR and TNR ·Training Case {XGBoost Model)
Future Analysls -lnformadonGaln
- .. - 1,.1 -
............... ~
--..,- .. ,,.~1""1 -
_ ,,. ..... _
"''1 .. _
ROC Curve · Training Case (XGBoost Model)
Threshold Oiscrimin tion Valut · Training Case (XGBoost)
Cu!-oti'ProbltMiity