

312
iv. Time under abutment-stress condition: The amount of time during which a pillar is under
the abutment-stress’ zone of influence defined in Fig. 3.
c. Solicitation:
These parameters intend to respond the following question: “How do the pillars actually
respond to the existing tensional field?”
The deformation parameters used in the model are referred to the deviatoric components
of the stress and strain tensors for an individual pillar, which are strongly dependent on the
stiffness which characterizes the mechanic properties of the material. In particular, shear
strains correspond to the mechanical response of the rockmass to the shear stresses it is
exposed to, without showing changes in its volume, up to the point where the cavity generated by the mining process is at its final stage.
In order to find an expression for the shear strains, starting from the stress tensor, it is necessary to follow a mathematical procedure which is now described: Given the stress tensor for
a determined position, expressed in terms of its rectangular coordinates (x,y,z), and assuming an end-stage cavity as a result of the mining process in a rockmass which is characterized
as a continuous, linearly elastic and isotropic medium, the shear strain γ ij for the ij plane can
be expressed in terms of the respective shear stress τ ij and two constants which describe the
mechanical properties of the rockmass, called Young’s Modulus E and Poisson’s ratio ν as
shown in Eq. 2:
γ
ν
ij
γ
E
=
+
1
(2)
The latter expression is a known result of the Lamé-Hooke Equations for elastic solids.
Each lithology has different mechanical properties (and, thus, distinctive characteristics).
Given the proportions of these lithologies populating a rockmass where a pillar is emplaced,
it is clear that each one has different mechanical conditions.
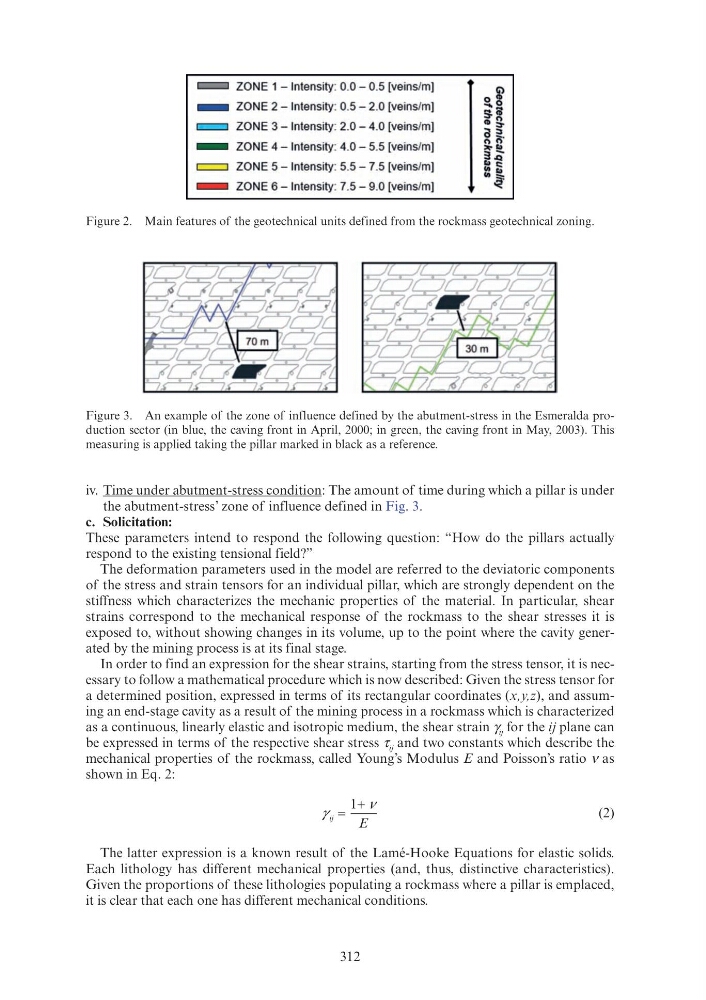
Figure 2. Main features of the geotechnical units defined from the rockmass geotechnical zoning.
Figure 3. An example of the zone of influence defined by the abutment-stress in the Esmeralda production sector (in blue, the caving front in April, 2000; in green, the caving front in May, 2003). This
measuring is applied taking the pillar marked in black as a reference.
ZONE 1 - Intensity: 0.0 - 0.5 [veins/m]
G')
0
ZONE 2 - Intensity: 0.5 - 2.0 [veins/m]
-..a 5-<11
i==:l ZONE 3- Intensity 2.0 - 4.0 [veins/m]
-
ZONE 4- Intensity 4.0 - 5.5 [veins/m]
,..Ill
3ZONE 5 - Intensity: 5.5 - 7.5 [veins/m]
lli .Q
i==:l
"'~
-
ZONE 6 - Intensity 7.5 - 9.0 [veins/m]
~~~~
iv. Time under abutment-stress condition: The amount of time during which a pillar is under
the abutment-stress’ zone of influence defined in Fig. 3.
c. Solicitation:
These parameters intend to respond the following question: “How do the pillars actually
respond to the existing tensional field?”
The deformation parameters used in the model are referred to the deviatoric components
of the stress and strain tensors for an individual pillar, which are strongly dependent on the
stiffness which characterizes the mechanic properties of the material. In particular, shear
strains correspond to the mechanical response of the rockmass to the shear stresses it is
exposed to, without showing changes in its volume, up to the point where the cavity generated by the mining process is at its final stage.
In order to find an expression for the shear strains, starting from the stress tensor, it is necessary to follow a mathematical procedure which is now described: Given the stress tensor for
a determined position, expressed in terms of its rectangular coordinates (x,y,z), and assuming an end-stage cavity as a result of the mining process in a rockmass which is characterized
as a continuous, linearly elastic and isotropic medium, the shear strain γ ij for the ij plane can
be expressed in terms of the respective shear stress τ ij and two constants which describe the
mechanical properties of the rockmass, called Young’s Modulus E and Poisson’s ratio ν as
shown in Eq. 2:
γ
ν
ij
γ
E
=
+
1
(2)
The latter expression is a known result of the Lamé-Hooke Equations for elastic solids.
Each lithology has different mechanical properties (and, thus, distinctive characteristics).
Given the proportions of these lithologies populating a rockmass where a pillar is emplaced,
it is clear that each one has different mechanical conditions.
Figure 2. Main features of the geotechnical units defined from the rockmass geotechnical zoning.
Figure 3. An example of the zone of influence defined by the abutment-stress in the Esmeralda production sector (in blue, the caving front in April, 2000; in green, the caving front in May, 2003). This
measuring is applied taking the pillar marked in black as a reference.
ZONE 1 - Intensity: 0.0 - 0.5 [veins/m]
G')
0
ZONE 2 - Intensity: 0.5 - 2.0 [veins/m]
-..a 5-<11
i==:l ZONE 3- Intensity 2.0 - 4.0 [veins/m]
-
ZONE 4- Intensity 4.0 - 5.5 [veins/m]
,..Ill
3ZONE 5 - Intensity: 5.5 - 7.5 [veins/m]
lli .Q
i==:l
"'~
-
ZONE 6 - Intensity 7.5 - 9.0 [veins/m]
~~~~