

295
2.2 Implementation
The MIP model was implemented in Python 3.7 using the Anaconda distribution. Google
OR Tools was used as solver.
At first, the code was written and tested in Jupyter Notebook environment. Then a GUI
(graphical user interface) was built using wxFormBuilder. Finally a single.exe application was
built with Pyinstaller, making it easier to share with other users.
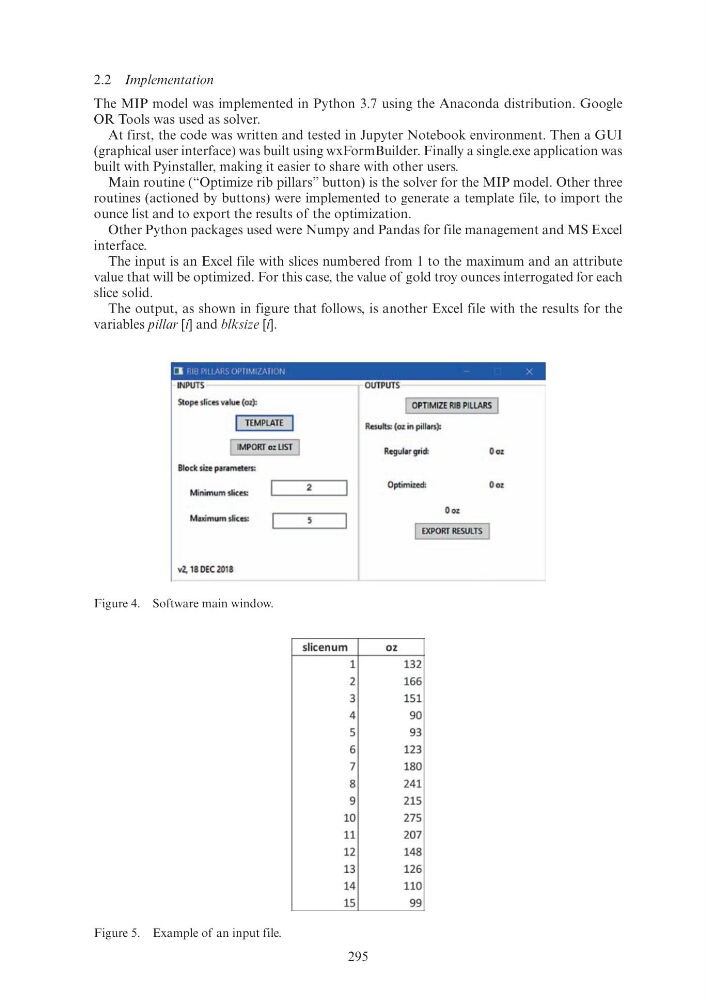
Main routine (“Optimize rib pillars” button) is the solver for the MIP model. Other three
routines (actioned by buttons) were implemented to generate a template file, to import the
ounce list and to export the results of the optimization.
Other Python packages used were Numpy and Pandas for file management and MS Excel
interface.
The input is an Excel file with slices numbered from 1 to the maximum and an attribute
value that will be optimized. For this case, the value of gold troy ounces interrogated for each
slice solid.
The output, as shown in figure that follows, is another Excel file with the results for the
variables pillar [i] and blksize [i].
Figure 4. Software main window.
Figure 5. Example of an input file.
[I RIB PILlARS OPTIMIZATION
X
INPUTS
OUTPUTS
Stope slices value (oz):
I OPTIMIZE RIB PILLARS I
I TEMPLATE
Rosults: (oz in pillars):
I IMPORT oz UST I
Regular grid:
0 oz
Block size parameters:
Minimum slic~s:
Optimiz~:
2
0 oz
Maximum slic!s:
v2.. 18 DEC 2018
I EXPORT RESULTS I
l
slicenum
oz
1
132
2
166
3
151
4
90
5
93
6
123
7
180
8
241
9
215
10
275
11
207
12
148
13
126
14
110
15
99
2.2 Implementation
The MIP model was implemented in Python 3.7 using the Anaconda distribution. Google
OR Tools was used as solver.
At first, the code was written and tested in Jupyter Notebook environment. Then a GUI
(graphical user interface) was built using wxFormBuilder. Finally a single.exe application was
built with Pyinstaller, making it easier to share with other users.
Main routine (“Optimize rib pillars” button) is the solver for the MIP model. Other three
routines (actioned by buttons) were implemented to generate a template file, to import the
ounce list and to export the results of the optimization.
Other Python packages used were Numpy and Pandas for file management and MS Excel
interface.
The input is an Excel file with slices numbered from 1 to the maximum and an attribute
value that will be optimized. For this case, the value of gold troy ounces interrogated for each
slice solid.
The output, as shown in figure that follows, is another Excel file with the results for the
variables pillar [i] and blksize [i].
Figure 4. Software main window.
Figure 5. Example of an input file.
[I RIB PILlARS OPTIMIZATION
X
INPUTS
OUTPUTS
Stope slices value (oz):
I OPTIMIZE RIB PILLARS I
I TEMPLATE
Rosults: (oz in pillars):
I IMPORT oz UST I
Regular grid:
0 oz
Block size parameters:
Minimum slic~s:
Optimiz~:
2
0 oz
Maximum slic!s:
v2.. 18 DEC 2018
I EXPORT RESULTS I
l
slicenum
oz
1
132
2
166
3
151
4
90
5
93
6
123
7
180
8
241
9
215
10
275
11
207
12
148
13
126
14
110
15
99