

293
Pillars can be horizontal (sill pillars) or vertical (rib pillars). Since there is less room for
changing sill pillars layout, this work focused only in the rib pillars placement.
Among the existing methods to calculate the location and amount of pillars needed,
Mathew’s stability graph is widely used. It is an empirical method and it should be adapted
to each mine’s parameters (Melo et al, 214). The result of this geotechnical evaluation is the
horizontal maximum length of a stope (i.e. stope span) and the minimum horizontal length
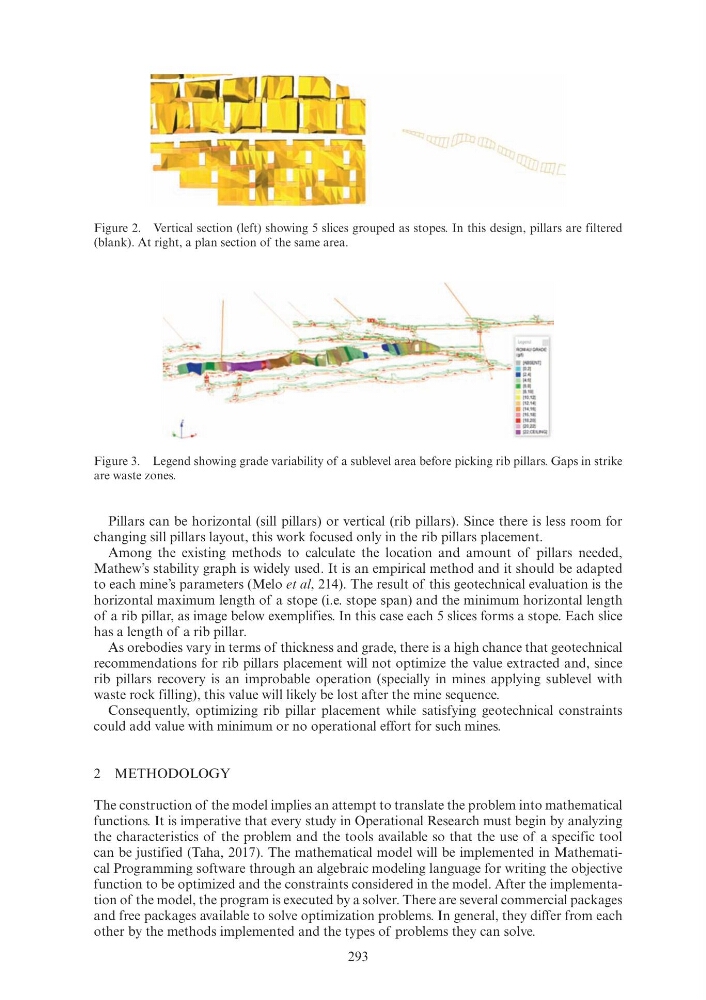
of a rib pillar, as image below exemplifies. In this case each 5 slices forms a stope. Each slice
has a length of a rib pillar.
As orebodies vary in terms of thickness and grade, there is a high chance that geotechnical
recommendations for rib pillars placement will not optimize the value extracted and, since
rib pillars recovery is an improbable operation (specially in mines applying sublevel with
waste rock filling), this value will likely be lost after the mine sequence.
Consequently, optimizing rib pillar placement while satisfying geotechnical constraints
could add value with minimum or no operational effort for such mines.
2 METHODOLOGY
The construction of the model implies an attempt to translate the problem into mathematical
functions. It is imperative that every study in Operational Research must begin by analyzing
the characteristics of the problem and the tools available so that the use of a specific tool
can be justified (Taha, 2017). The mathematical model will be implemented in Mathematical Programming software through an algebraic modeling language for writing the objective
function to be optimized and the constraints considered in the model. After the implementation of the model, the program is executed by a solver. There are several commercial packages
and free packages available to solve optimization problems. In general, they differ from each
other by the methods implemented and the types of problems they can solve.
Figure 2. Vertical section (left) showing 5 slices grouped as stopes. In this design, pillars are filtered
(blank). At right, a plan section of the same area.
Figure 3. Legend showing grade variability of a sublevel area before picking rib pillars. Gaps in strike
are waste zones.
-
"""''"""""
""
- ."""""
- . 10.2:1
· ~·
..
.. . .
11.101
[101~
[12,1')
. ,,.,111J
8 11t,tlf
. , .. .20!
. . ..,
."' """""
Pillars can be horizontal (sill pillars) or vertical (rib pillars). Since there is less room for
changing sill pillars layout, this work focused only in the rib pillars placement.
Among the existing methods to calculate the location and amount of pillars needed,
Mathew’s stability graph is widely used. It is an empirical method and it should be adapted
to each mine’s parameters (Melo et al, 214). The result of this geotechnical evaluation is the
horizontal maximum length of a stope (i.e. stope span) and the minimum horizontal length
of a rib pillar, as image below exemplifies. In this case each 5 slices forms a stope. Each slice
has a length of a rib pillar.
As orebodies vary in terms of thickness and grade, there is a high chance that geotechnical
recommendations for rib pillars placement will not optimize the value extracted and, since
rib pillars recovery is an improbable operation (specially in mines applying sublevel with
waste rock filling), this value will likely be lost after the mine sequence.
Consequently, optimizing rib pillar placement while satisfying geotechnical constraints
could add value with minimum or no operational effort for such mines.
2 METHODOLOGY
The construction of the model implies an attempt to translate the problem into mathematical
functions. It is imperative that every study in Operational Research must begin by analyzing
the characteristics of the problem and the tools available so that the use of a specific tool
can be justified (Taha, 2017). The mathematical model will be implemented in Mathematical Programming software through an algebraic modeling language for writing the objective
function to be optimized and the constraints considered in the model. After the implementation of the model, the program is executed by a solver. There are several commercial packages
and free packages available to solve optimization problems. In general, they differ from each
other by the methods implemented and the types of problems they can solve.
Figure 2. Vertical section (left) showing 5 slices grouped as stopes. In this design, pillars are filtered
(blank). At right, a plan section of the same area.
Figure 3. Legend showing grade variability of a sublevel area before picking rib pillars. Gaps in strike
are waste zones.
-
"""''"""""
""
- ."""""
- . 10.2:1
· ~·
..
.. . .
11.101
[101~
[12,1')
. ,,.,111J
8 11t,tlf
. , .. .20!
. . ..,
."' """""