

289
i. Spatial mapping of areas of greatest variability in order to identify targets for short-term
geological mapping prior to the operation, in order to better detail these areas and reduce
their uncertainty.
ii. Calculation of the risk indicator that will be used to create the prioritization scale and
scheduling the stopes in order to anticipate the lower risk stopes and delay those with
higher geological risks.
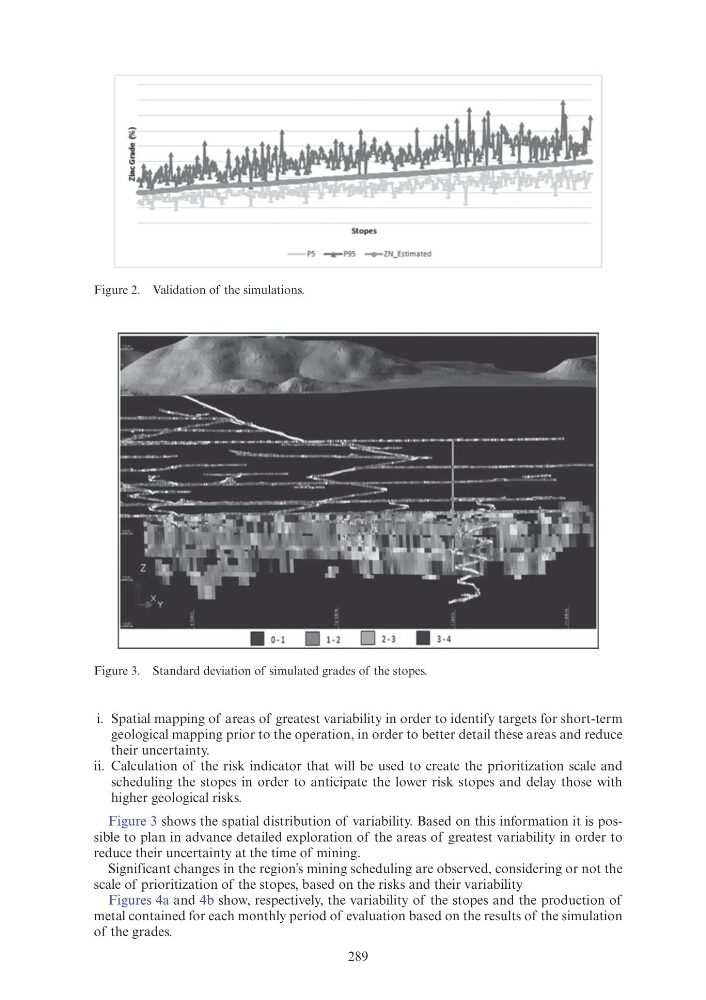
Figure 3 shows the spatial distribution of variability. Based on this information it is possible to plan in advance detailed exploration of the areas of greatest variability in order to
reduce their uncertainty at the time of mining.
Significant changes in the region’s mining scheduling are observed, considering or not the
scale of prioritization of the stopes, based on the risks and their variability
Figures 4a and 4b show, respectively, the variability of the stopes and the production of
metal contained for each monthly period of evaluation based on the results of the simulation
of the grades.
Figure 2. Validation of the simulations.
Figure 3. Standard deviation of simulated grades of the stopes.
Slopes
i. Spatial mapping of areas of greatest variability in order to identify targets for short-term
geological mapping prior to the operation, in order to better detail these areas and reduce
their uncertainty.
ii. Calculation of the risk indicator that will be used to create the prioritization scale and
scheduling the stopes in order to anticipate the lower risk stopes and delay those with
higher geological risks.
Figure 3 shows the spatial distribution of variability. Based on this information it is possible to plan in advance detailed exploration of the areas of greatest variability in order to
reduce their uncertainty at the time of mining.
Significant changes in the region’s mining scheduling are observed, considering or not the
scale of prioritization of the stopes, based on the risks and their variability
Figures 4a and 4b show, respectively, the variability of the stopes and the production of
metal contained for each monthly period of evaluation based on the results of the simulation
of the grades.
Figure 2. Validation of the simulations.
Figure 3. Standard deviation of simulated grades of the stopes.
Slopes