

288
2.1 Mine planning
The mine planning was divided in two parts to carry out the study: design and schedule of
the stopes.
Regarding the mining design, there were no changes regarding the market, geomechanical
and operational parameters adopted for deterministic planning. The amount of 30 design
scenarios required was specified so as not to impact the analysis of results. Thus, 30 designs
for each stope were performed in the study area with the optimization tool based on each of
the simulated grades through Sequential Gaussian Simulation (SGS).
From this, the density of each stope for each scenario was calculated through a regression
with the simulated grades, which is already used in the estimated model and has a high correlation (93%).
Knowing the volume, grade and density for each stope for each simulated scenario, it was
possible to construct normal distribution curves of the grade and the contained metal (after
confirming their normality) and to determine the standard deviation and the Risk Indicator
of the stopes.
The Risk Indicator is calculated as shown:
IR
P
P
P
=
>
e Pam
<
<
Pae
<
e Pam
1
0
se Pae > 80
0 50
2
0
se 50
0 80
3
0
se Pae > 50
0 5
,
,
e Pam >
e Pam
80
0
,
,
ae
<
<
Pae
50
0
,
,
e Pam <
e Pam 0 0 0
⎧
⎨
⎪
⎧ ⎧
⎨ ⎨
⎩
⎪
⎨ ⎨
⎩ ⎩
where:
IR: Risk Indicator.
Pae: Probability of the metal contained on the stope being above the estimated value.
Pam: Probability of the zinc grade being above the average zinc grade of the mineral reserve
(zinc grade = 10,5%).
The risk indicator was calculated for each stope as shown in equation 3. Then, a priority
scale was created where stopes classified as 1 should be programmed first, followed by stopes
classified as 2 and then stopes classified as 3.
Regarding the production scheduling, it was carried out contemplating three factors:
i. Mass of ore and metal contained monthly planned for customers (considering only the
studied region of the mine).
ii. Logical scheduling of mining.
iii. Prioritization scale based on the IR.
3 RESULTS AND DISCUSSION
After the validations of the simulations, calculation of the density and design of each stope
for each of the 30 scenarios, the evaluations were performed.
Figure 2 shows the results of the simulations in relation to the estimated value. Note,
the estimated grade is within the simulated values curve (percentile 5 and percentile 95), as
expected.
The results of the metal content and grade simulations for each stope were used on two
work fronts:
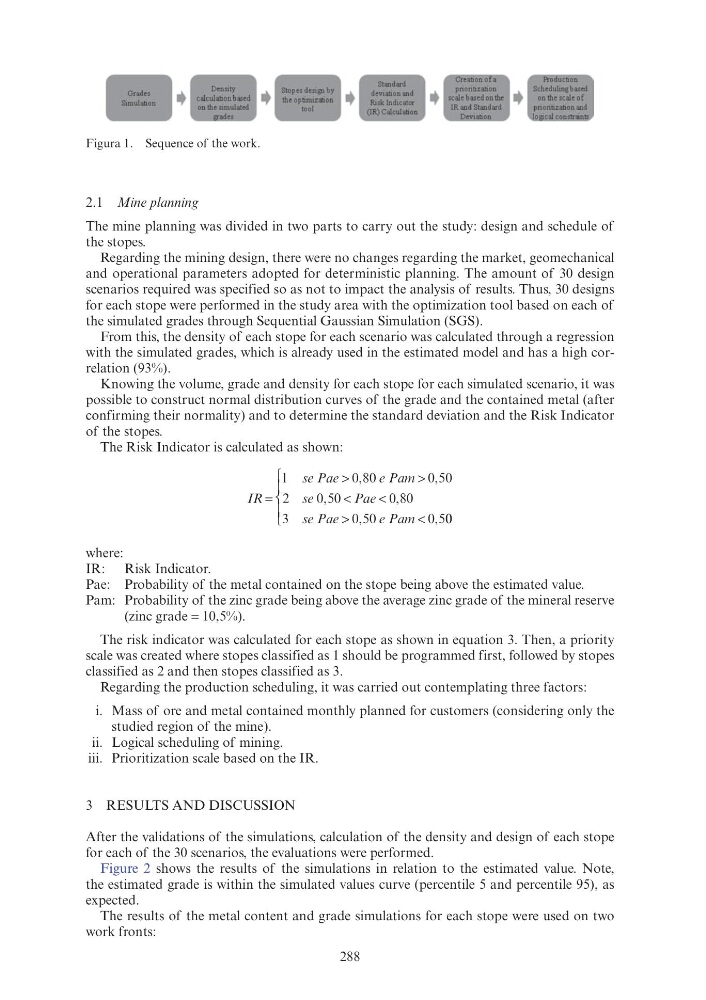
Figura 1. Sequence of the work.
andes
Simullllion
2.1 Mine planning
The mine planning was divided in two parts to carry out the study: design and schedule of
the stopes.
Regarding the mining design, there were no changes regarding the market, geomechanical
and operational parameters adopted for deterministic planning. The amount of 30 design
scenarios required was specified so as not to impact the analysis of results. Thus, 30 designs
for each stope were performed in the study area with the optimization tool based on each of
the simulated grades through Sequential Gaussian Simulation (SGS).
From this, the density of each stope for each scenario was calculated through a regression
with the simulated grades, which is already used in the estimated model and has a high correlation (93%).
Knowing the volume, grade and density for each stope for each simulated scenario, it was
possible to construct normal distribution curves of the grade and the contained metal (after
confirming their normality) and to determine the standard deviation and the Risk Indicator
of the stopes.
The Risk Indicator is calculated as shown:
IR
P
P
P
=
>
e Pam
<
<
Pae
<
e Pam
1
0
se Pae > 80
0 50
2
0
se 50
0 80
3
0
se Pae > 50
0 5
,
,
e Pam >
e Pam
80
0
,
,
ae
<
<
Pae
50
0
,
,
e Pam <
e Pam 0 0 0
⎧
⎨
⎪
⎧ ⎧
⎨ ⎨
⎩
⎪
⎨ ⎨
⎩ ⎩
where:
IR: Risk Indicator.
Pae: Probability of the metal contained on the stope being above the estimated value.
Pam: Probability of the zinc grade being above the average zinc grade of the mineral reserve
(zinc grade = 10,5%).
The risk indicator was calculated for each stope as shown in equation 3. Then, a priority
scale was created where stopes classified as 1 should be programmed first, followed by stopes
classified as 2 and then stopes classified as 3.
Regarding the production scheduling, it was carried out contemplating three factors:
i. Mass of ore and metal contained monthly planned for customers (considering only the
studied region of the mine).
ii. Logical scheduling of mining.
iii. Prioritization scale based on the IR.
3 RESULTS AND DISCUSSION
After the validations of the simulations, calculation of the density and design of each stope
for each of the 30 scenarios, the evaluations were performed.
Figure 2 shows the results of the simulations in relation to the estimated value. Note,
the estimated grade is within the simulated values curve (percentile 5 and percentile 95), as
expected.
The results of the metal content and grade simulations for each stope were used on two
work fronts:
Figura 1. Sequence of the work.
andes
Simullllion