

274
(i) it contains enough space for the ramps, and (ii) it has a value as close as possible to the
original pit. Finally, the postprocessing algorithm transforms the output of the algorithm (i.e.
the pre-design pushback plus information about the ramp estimated location) and produces
an operational pit profile.
2.1 Computing the pre-designed pushback
The pre-designed pushback starts with a block model that includes economic values
of the blocks and a pit profile. From this, it will select specific points that aim to estimate the block at which the ramp passes at every level (if the ramp is wider than 1 block,
it looks at the outer block). These points can be inside or outside the initial profile, with
tolerance distances defined by the user. The model uses these points to estimate the
blocks that need to be extracted and generate space for a ramp and from that it estimates
the total value of the new volume being computed. The goal is then to maximize the value
of that goal.
Further details on the equations of the model can be found in (Morales 2017), and an
example of the application of this model in (Nancel-Penard 2018), however it is key to mention that as output, the mathematical model generates the following:
− The set of all blocks that should be extracted.
− A set of control points for the ramp, i.e., a list of blocks that form part of the ramp.
It is also important to notice that, since the model works at the block support, everything
has to be approximated by blocks. In particular, for example, the width of the ramp, it’s
slope, etc.
2.2 Generating the smooth profile
This step is an algorithm that aims to fit an operational ramp into the pre-design
phase obtained from the block model. For this, the algorithm utilizes not only the profile,
but the control points of the ramp at each level and aims to interpolate them using an actual
ramp.
The algorithm starts uses the block model and the following standard design parameters:
berm and haul ramp widths, global slope angle, bench face angle and interramp angle as
depicted in Figure 3 (Left), as well as a number of bencher over which to measure the global
slope angle. It also takes as input the result of the mathematical model, which is schematically
represented in Figure 3 (Right).
Notice that the algorithm does not consider the ramp slope, as this is already taken into
account in the optimization model.
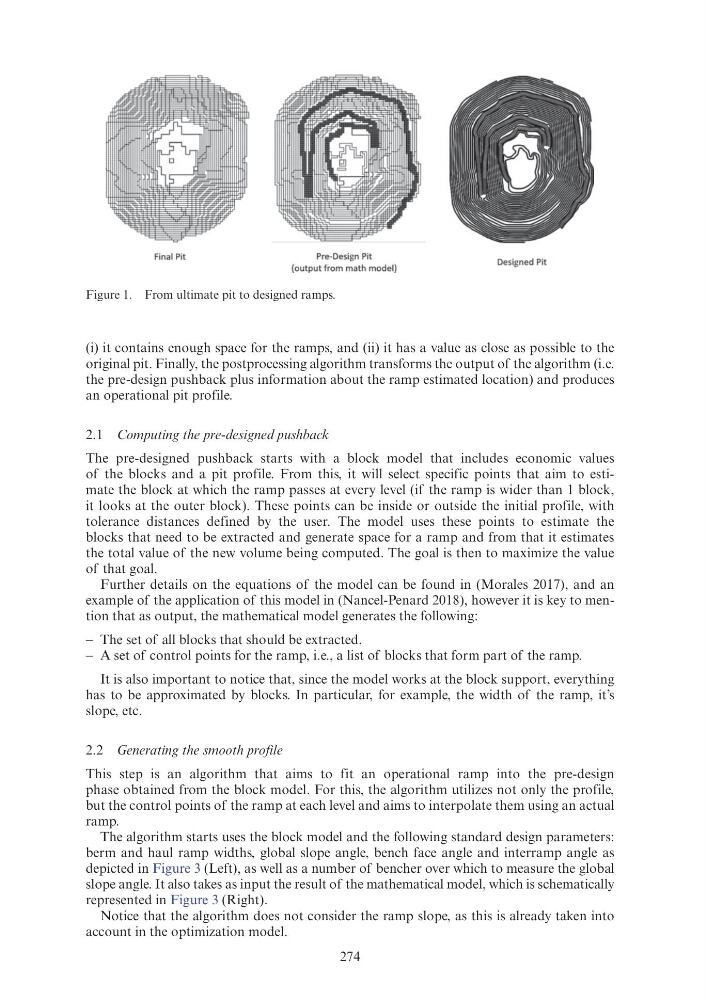
Figure 1. From ultimate pit to designed ramps.
Final Pit
Pre-Design Pit
(output from math model)
Designed Pit
(i) it contains enough space for the ramps, and (ii) it has a value as close as possible to the
original pit. Finally, the postprocessing algorithm transforms the output of the algorithm (i.e.
the pre-design pushback plus information about the ramp estimated location) and produces
an operational pit profile.
2.1 Computing the pre-designed pushback
The pre-designed pushback starts with a block model that includes economic values
of the blocks and a pit profile. From this, it will select specific points that aim to estimate the block at which the ramp passes at every level (if the ramp is wider than 1 block,
it looks at the outer block). These points can be inside or outside the initial profile, with
tolerance distances defined by the user. The model uses these points to estimate the
blocks that need to be extracted and generate space for a ramp and from that it estimates
the total value of the new volume being computed. The goal is then to maximize the value
of that goal.
Further details on the equations of the model can be found in (Morales 2017), and an
example of the application of this model in (Nancel-Penard 2018), however it is key to mention that as output, the mathematical model generates the following:
− The set of all blocks that should be extracted.
− A set of control points for the ramp, i.e., a list of blocks that form part of the ramp.
It is also important to notice that, since the model works at the block support, everything
has to be approximated by blocks. In particular, for example, the width of the ramp, it’s
slope, etc.
2.2 Generating the smooth profile
This step is an algorithm that aims to fit an operational ramp into the pre-design
phase obtained from the block model. For this, the algorithm utilizes not only the profile,
but the control points of the ramp at each level and aims to interpolate them using an actual
ramp.
The algorithm starts uses the block model and the following standard design parameters:
berm and haul ramp widths, global slope angle, bench face angle and interramp angle as
depicted in Figure 3 (Left), as well as a number of bencher over which to measure the global
slope angle. It also takes as input the result of the mathematical model, which is schematically
represented in Figure 3 (Right).
Notice that the algorithm does not consider the ramp slope, as this is already taken into
account in the optimization model.
Figure 1. From ultimate pit to designed ramps.
Final Pit
Pre-Design Pit
(output from math model)
Designed Pit