

262
costs as used, variations on these parameters might turn MSDS scenarios more attractive.
Increasing final dump distance to 4.64 km (50% increase) and keeping the same haulage
and loading costs result in 2.39%, 3,03% and 2,37% lower NPV costs for MSDS 2, 3 and 4.
Meanwhile, if final dump distance reduces to 2.71 km, none of MSDS scenarios tested would
result in lower total costs. Same kind of behavior is observed when changing other parameters. It can be observed that there is a limit where one alternative becomes more attractive,
economically, than the others.
4 CONCLUSION
Waste re-handling is historically an issue in mining operations, avoided and/or postponed
as much as possible due to increase in total operating cost. Moreover, waste re-handling has
been always considered to be the worst case scenario by default. However, a planned waste
re-handling might impact positively, opening new alternatives for mine operation and planning. Four MSDS scenarios were tested and compared to a base case, and among them, the
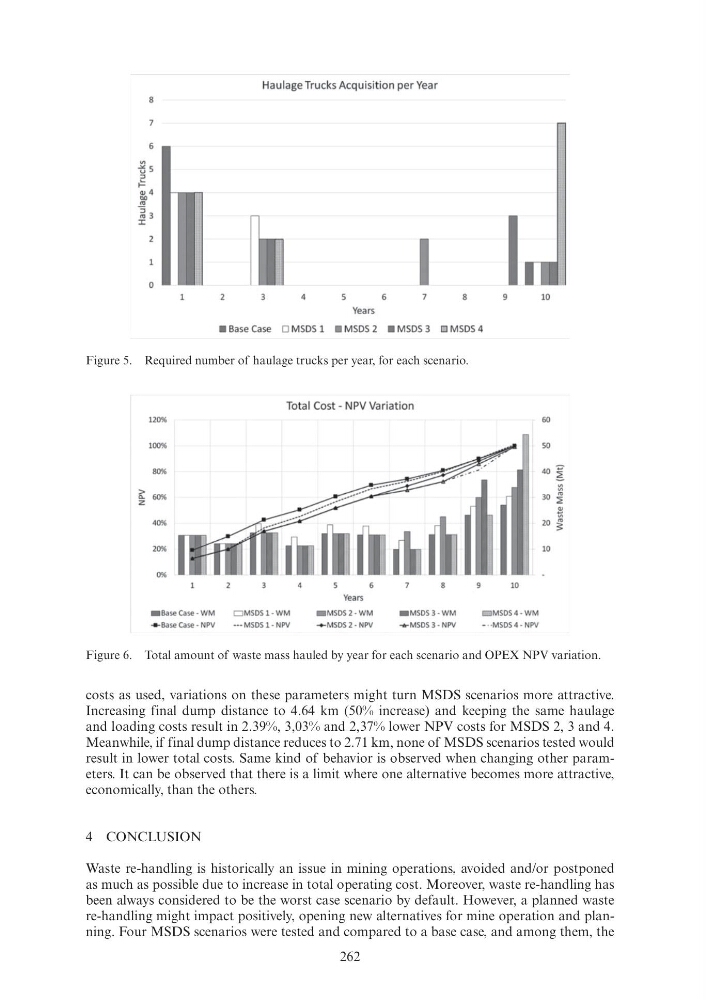
Figure 5. Required number of haulage trucks per year, for each scenario.
Figure 6. Total amount of waste mass hauled by year for each scenario and OPEX NPV variation.
costs as used, variations on these parameters might turn MSDS scenarios more attractive.
Increasing final dump distance to 4.64 km (50% increase) and keeping the same haulage
and loading costs result in 2.39%, 3,03% and 2,37% lower NPV costs for MSDS 2, 3 and 4.
Meanwhile, if final dump distance reduces to 2.71 km, none of MSDS scenarios tested would
result in lower total costs. Same kind of behavior is observed when changing other parameters. It can be observed that there is a limit where one alternative becomes more attractive,
economically, than the others.
4 CONCLUSION
Waste re-handling is historically an issue in mining operations, avoided and/or postponed
as much as possible due to increase in total operating cost. Moreover, waste re-handling has
been always considered to be the worst case scenario by default. However, a planned waste
re-handling might impact positively, opening new alternatives for mine operation and planning. Four MSDS scenarios were tested and compared to a base case, and among them, the
Figure 5. Required number of haulage trucks per year, for each scenario.
Figure 6. Total amount of waste mass hauled by year for each scenario and OPEX NPV variation.