

261
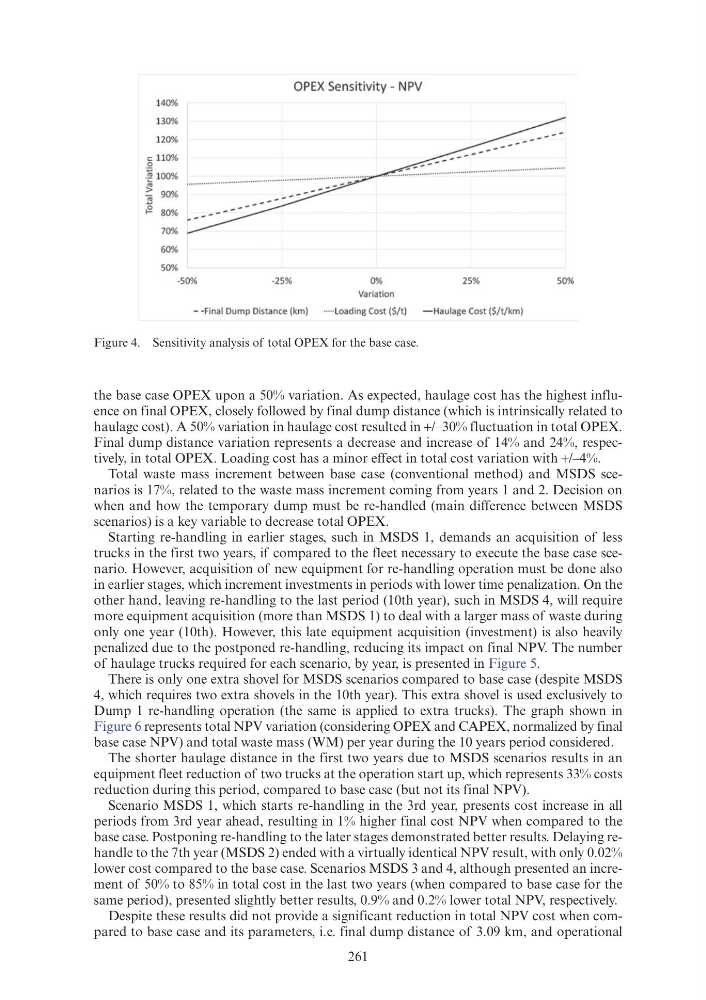
the base case OPEX upon a 50% variation. As expected, haulage cost has the highest influence on final OPEX, closely followed by final dump distance (which is intrinsically related to
haulage cost). A 50% variation in haulage cost resulted in +/–30% fluctuation in total OPEX.
Final dump distance variation represents a decrease and increase of 14% and 24%, respectively, in total OPEX. Loading cost has a minor effect in total cost variation with +/–4%.
Total waste mass increment between base case (conventional method) and MSDS scenarios is 17%, related to the waste mass increment coming from years 1 and 2. Decision on
when and how the temporary dump must be re-handled (main difference between MSDS
scenarios) is a key variable to decrease total OPEX.
Starting re-handling in earlier stages, such in MSDS 1, demands an acquisition of less
trucks in the first two years, if compared to the fleet necessary to execute the base case scenario. However, acquisition of new equipment for re-handling operation must be done also
in earlier stages, which increment investments in periods with lower time penalization. On the
other hand, leaving re-handling to the last period (10th year), such in MSDS 4, will require
more equipment acquisition (more than MSDS 1) to deal with a larger mass of waste during
only one year (10th). However, this late equipment acquisition (investment) is also heavily
penalized due to the postponed re-handling, reducing its impact on final NPV. The number
of haulage trucks required for each scenario, by year, is presented in Figure 5.
There is only one extra shovel for MSDS scenarios compared to base case (despite MSDS
4, which requires two extra shovels in the 10th year). This extra shovel is used exclusively to
Dump 1 re-handling operation (the same is applied to extra trucks). The graph shown in
Figure 6 represents total NPV variation (considering OPEX and CAPEX, normalized by final
base case NPV) and total waste mass (WM) per year during the 10 years period considered.
The shorter haulage distance in the first two years due to MSDS scenarios results in an
equipment fleet reduction of two trucks at the operation start up, which represents 33% costs
reduction during this period, compared to base case (but not its final NPV).
Scenario MSDS 1, which starts re-handling in the 3rd year, presents cost increase in all
periods from 3rd year ahead, resulting in 1% higher final cost NPV when compared to the
base case. Postponing re-handling to the later stages demonstrated better results. Delaying rehandle to the 7th year (MSDS 2) ended with a virtually identical NPV result, with only 0.02%
lower cost compared to the base case. Scenarios MSDS 3 and 4, although presented an increment of 50% to 85% in total cost in the last two years (when compared to base case for the
same period), presented slightly better results, 0.9% and 0.2% lower total NPV, respectively.
Despite these results did not provide a significant reduction in total NPV cost when compared to base case and its parameters, i.e. final dump distance of 3.09 km, and operational
Figure 4. Sensitivity analysis of total OPEX for the base case.
140%
130%
120%
c 110%
0
:~ 100%
~ 90%
"'
~ 80%
70%
60%
SO%
OPEX Sensitivity- NPV
-50%
-25%
0%
Va riat ion
25%
--Final Dump Distance (km)
·····Loading Cost ($/t )
- Haulage Cost ($/t/km)
50%
the base case OPEX upon a 50% variation. As expected, haulage cost has the highest influence on final OPEX, closely followed by final dump distance (which is intrinsically related to
haulage cost). A 50% variation in haulage cost resulted in +/–30% fluctuation in total OPEX.
Final dump distance variation represents a decrease and increase of 14% and 24%, respectively, in total OPEX. Loading cost has a minor effect in total cost variation with +/–4%.
Total waste mass increment between base case (conventional method) and MSDS scenarios is 17%, related to the waste mass increment coming from years 1 and 2. Decision on
when and how the temporary dump must be re-handled (main difference between MSDS
scenarios) is a key variable to decrease total OPEX.
Starting re-handling in earlier stages, such in MSDS 1, demands an acquisition of less
trucks in the first two years, if compared to the fleet necessary to execute the base case scenario. However, acquisition of new equipment for re-handling operation must be done also
in earlier stages, which increment investments in periods with lower time penalization. On the
other hand, leaving re-handling to the last period (10th year), such in MSDS 4, will require
more equipment acquisition (more than MSDS 1) to deal with a larger mass of waste during
only one year (10th). However, this late equipment acquisition (investment) is also heavily
penalized due to the postponed re-handling, reducing its impact on final NPV. The number
of haulage trucks required for each scenario, by year, is presented in Figure 5.
There is only one extra shovel for MSDS scenarios compared to base case (despite MSDS
4, which requires two extra shovels in the 10th year). This extra shovel is used exclusively to
Dump 1 re-handling operation (the same is applied to extra trucks). The graph shown in
Figure 6 represents total NPV variation (considering OPEX and CAPEX, normalized by final
base case NPV) and total waste mass (WM) per year during the 10 years period considered.
The shorter haulage distance in the first two years due to MSDS scenarios results in an
equipment fleet reduction of two trucks at the operation start up, which represents 33% costs
reduction during this period, compared to base case (but not its final NPV).
Scenario MSDS 1, which starts re-handling in the 3rd year, presents cost increase in all
periods from 3rd year ahead, resulting in 1% higher final cost NPV when compared to the
base case. Postponing re-handling to the later stages demonstrated better results. Delaying rehandle to the 7th year (MSDS 2) ended with a virtually identical NPV result, with only 0.02%
lower cost compared to the base case. Scenarios MSDS 3 and 4, although presented an increment of 50% to 85% in total cost in the last two years (when compared to base case for the
same period), presented slightly better results, 0.9% and 0.2% lower total NPV, respectively.
Despite these results did not provide a significant reduction in total NPV cost when compared to base case and its parameters, i.e. final dump distance of 3.09 km, and operational
Figure 4. Sensitivity analysis of total OPEX for the base case.
140%
130%
120%
c 110%
0
:~ 100%
~ 90%
"'
~ 80%
70%
60%
SO%
OPEX Sensitivity- NPV
-50%
-25%
0%
Va riat ion
25%
--Final Dump Distance (km)
·····Loading Cost ($/t )
- Haulage Cost ($/t/km)
50%