

221
3.1 MWD data analysis
MWD data were collected from the drilling rigs. To extract information from the collected
data, an algorithm was developed using MATLAB. The development of the algorithm
included:
− Data importation
− Noise reduction
− Parameters extraction
− Variation detection
The drill monitoring system feature three types of files: drill plan (DP), drill quality (DQ),
and MWD. The DP file contains the drill plan that were transferred to the drill rig from the
mine office. The DQ file gives the status of the drilling process, whether it was successful or
if there were any failures during the drilling operation. The MWD file contains penetration
rate, percussive pressure, rotation pressure, feed pressure, damping pressure and flush pressure measured during the drilling process.
‘Hole ID’ and ‘Plan ID’ from the DQ file and the MWD file were used to import drilling parameters for the required boreholes. Data were imported into MATLAB and filtered
to remove noise or faulty MWD samples. Faulty samples included unrealistic values, e.g.
negative or abnormally high values for penetration rate or pressure. In addition, variations in
drilling parameters during rod changes are not representative samples of the rock behavior
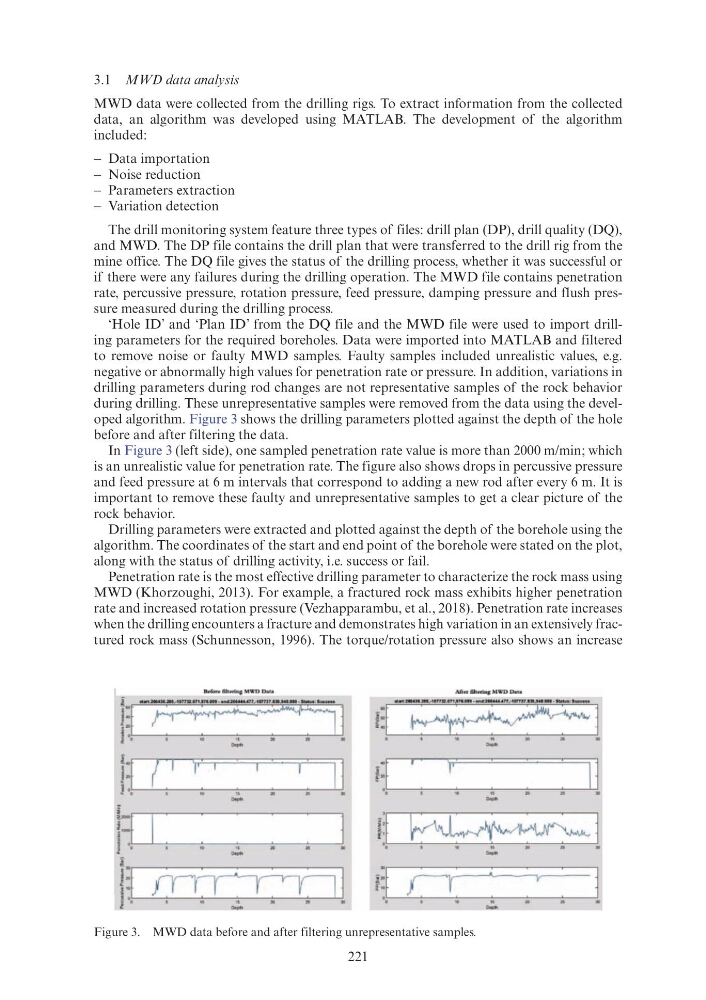
during drilling. These unrepresentative samples were removed from the data using the developed algorithm. Figure 3 shows the drilling parameters plotted against the depth of the hole
before and after filtering the data.
In Figure 3 (left side), one sampled penetration rate value is more than 2000 m/min; which
is an unrealistic value for penetration rate. The figure also shows drops in percussive pressure
and feed pressure at 6 m intervals that correspond to adding a new rod after every 6 m. It is
important to remove these faulty and unrepresentative samples to get a clear picture of the
rock behavior.
Drilling parameters were extracted and plotted against the depth of the borehole using the
algorithm. The coordinates of the start and end point of the borehole were stated on the plot,
along with the status of drilling activity, i.e. success or fail.
Penetration rate is the most effective drilling parameter to characterize the rock mass using
MWD (Khorzoughi, 2013). For example, a fractured rock mass exhibits higher penetration
rate and increased rotation pressure (Vezhapparambu, et al., 2018). Penetration rate increases
when the drilling encounters a fracture and demonstrates high variation in an extensively fractured rock mass (Schunnesson, 1996). The torque/rotation pressure also shows an increase
Figure 3. MWD data before and after filtering unrepresentative samples.
f~[ -~l
j Cl
I
10
'l
lD
l5
311
,.,.
t:r I : r ., •. ~ I . :, I ~ ' ~ 11
.,.,.
~f I : : : : : l
1 11 1 10 ' ' m a :11
.
.,.,.
l~t ffiiSS5l
'!!II
I
to
'l
XI
:Hi
311
l
.,.,.
AftH filterinJ !orwD Data
q ·-·~~l
-
1:[ , : . ,,: : : : 11
~
5
~
~
»
M
~
-
n~~~l 'a ~ ~ ~~ :aD 1!1 :II
-
f~[ -~l
j Cl
I
10
'l
lD
l5
311
,.,.
t:r I : r ., •. ~ I . :, I ~ ' ~ 11
.,.,.
~f I : : : : : l
1 11 1 10 ' ' m a :11
.
.,.,.
l~t ffiiSS5l
'!!II
I
to
'l
XI
:Hi
311
l
.,.,.
AftH filterinJ !orwD Data
q ·-·~~l
-
1:[ , : . ,,: : : : 11
~
5
~
~
»
M
~
-
n~~~l 'a ~ ~ ~~ :aD 1!1 :II
-
3.1 MWD data analysis
MWD data were collected from the drilling rigs. To extract information from the collected
data, an algorithm was developed using MATLAB. The development of the algorithm
included:
− Data importation
− Noise reduction
− Parameters extraction
− Variation detection
The drill monitoring system feature three types of files: drill plan (DP), drill quality (DQ),
and MWD. The DP file contains the drill plan that were transferred to the drill rig from the
mine office. The DQ file gives the status of the drilling process, whether it was successful or
if there were any failures during the drilling operation. The MWD file contains penetration
rate, percussive pressure, rotation pressure, feed pressure, damping pressure and flush pressure measured during the drilling process.
‘Hole ID’ and ‘Plan ID’ from the DQ file and the MWD file were used to import drilling parameters for the required boreholes. Data were imported into MATLAB and filtered
to remove noise or faulty MWD samples. Faulty samples included unrealistic values, e.g.
negative or abnormally high values for penetration rate or pressure. In addition, variations in
drilling parameters during rod changes are not representative samples of the rock behavior
during drilling. These unrepresentative samples were removed from the data using the developed algorithm. Figure 3 shows the drilling parameters plotted against the depth of the hole
before and after filtering the data.
In Figure 3 (left side), one sampled penetration rate value is more than 2000 m/min; which
is an unrealistic value for penetration rate. The figure also shows drops in percussive pressure
and feed pressure at 6 m intervals that correspond to adding a new rod after every 6 m. It is
important to remove these faulty and unrepresentative samples to get a clear picture of the
rock behavior.
Drilling parameters were extracted and plotted against the depth of the borehole using the
algorithm. The coordinates of the start and end point of the borehole were stated on the plot,
along with the status of drilling activity, i.e. success or fail.
Penetration rate is the most effective drilling parameter to characterize the rock mass using
MWD (Khorzoughi, 2013). For example, a fractured rock mass exhibits higher penetration
rate and increased rotation pressure (Vezhapparambu, et al., 2018). Penetration rate increases
when the drilling encounters a fracture and demonstrates high variation in an extensively fractured rock mass (Schunnesson, 1996). The torque/rotation pressure also shows an increase
Figure 3. MWD data before and after filtering unrepresentative samples.
f~[ -~l
j Cl
I
10
'l
lD
l5
311
,.,.
t:r I : r ., •. ~ I . :, I ~ ' ~ 11
.,.,.
~f I : : : : : l
1 11 1 10 ' ' m a :11
.
.,.,.
l~t ffiiSS5l
'!!II
I
to
'l
XI
:Hi
311
l
.,.,.
AftH filterinJ !orwD Data
q ·-·~~l
-
1:[ , : . ,,: : : : 11
~
5
~
~
»
M
~
-
n~~~l 'a ~ ~ ~~ :aD 1!1 :II
-
f~[ -~l
j Cl
I
10
'l
lD
l5
311
,.,.
t:r I : r ., •. ~ I . :, I ~ ' ~ 11
.,.,.
~f I : : : : : l
1 11 1 10 ' ' m a :11
.
.,.,.
l~t ffiiSS5l
'!!II
I
to
'l
XI
:Hi
311
l
.,.,.
AftH filterinJ !orwD Data
q ·-·~~l
-
1:[ , : . ,,: : : : 11
~
5
~
~
»
M
~
-
n~~~l 'a ~ ~ ~~ :aD 1!1 :II
-