

195
3 RESOURCE MODELLING
3.1 Initial models
Initial modelling in 2009 utilised just 46 drillholes on a 400 m to 800 m spacing, with the mineralised horizon defined using a 1% Cu cut-off, with a minimum 3 m downhole thickness to
ensure the mineralised horizon could be considered mineable utilising underground methods.
In low grade areas, where the 1% cut-off was <3 m, the interval was diluted to 3 m to introduce lateral dilution into the model. Drillholes were composited across the full mineralised
interval to define a single average value per drillhole.
A 100 m by 100 m block model was created within the modelling limits and draped onto a
surface modelled using trend-surface analysis within individual fault blocks, whereby a firstor second-order polynomial trend surface was fitted to the drill data, and the residuals from
this surface modelled using two-dimensional inverse distance squared (ID2) weighting. Copper
grade was back-calculated from estimates of true thickness and metal accumulation (Cu% * true
thickness), also using ID2 at a datum elevation. When used at Kakula, density weighting was
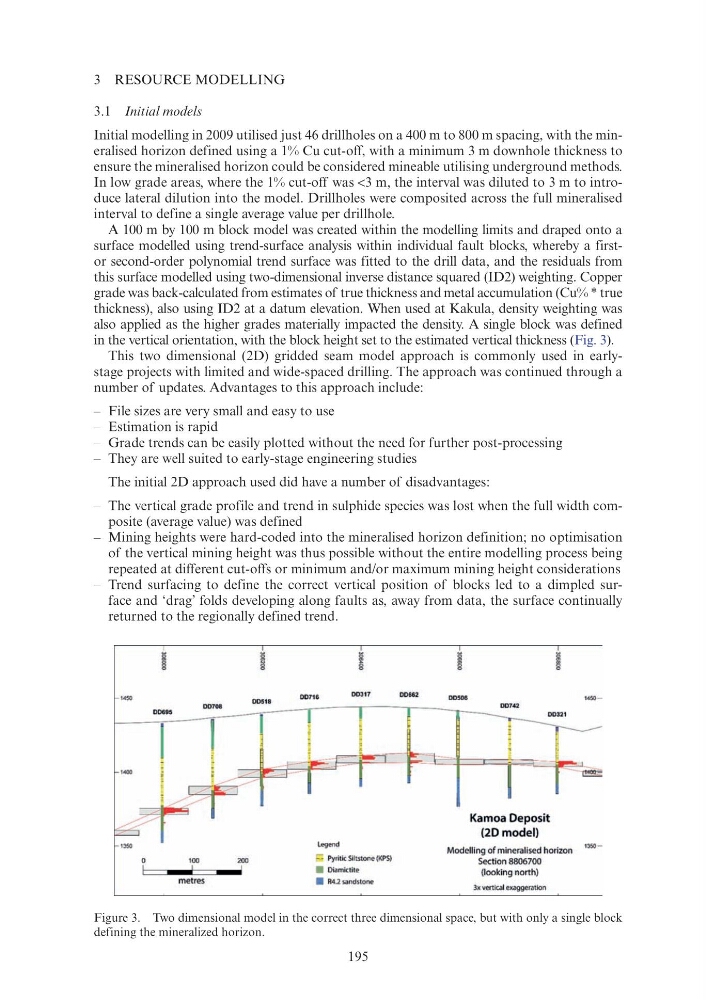
also applied as the higher grades materially impacted the density. A single block was defined
in the vertical orientation, with the block height set to the estimated vertical thickness (Fig. 3).
This two dimensional (2D) gridded seam model approach is commonly used in earlystage projects with limited and wide-spaced drilling. The approach was continued through a
number of updates. Advantages to this approach include:
– File sizes are very small and easy to use
– Estimation is rapid
– Grade trends can be easily plotted without the need for further post-processing
– They are well suited to early-stage engineering studies
The initial 2D approach used did have a number of disadvantages:
– The vertical grade profile and trend in sulphide species was lost when the full width composite (average value) was defined
– Mining heights were hard-coded into the mineralised horizon definition; no optimisation
of the vertical mining height was thus possible without the entire modelling process being
repeated at different cut-offs or minimum and/or maximum mining height considerations
– Trend surfacing to define the correct vertical position of blocks led to a dimpled surface and ‘drag’ folds developing along faults as, away from data, the surface continually
returned to the regionally defined trend.
Figure 3. Two dimensional model in the correct three dimensional space, but with only a single block
defining the mineralized horizon.
ft
~
8
1450
0 0 518
00708
0 0695
1350
100
200
metres
~
8
00716
0 0 317
0 0662
legend
Pyritic Siltstone (KPS)
•
Diamictite
•
R4.2 sandsto ne
~
8
00506
00742
Kamoa Deposit
(2Dmodel)
I
Modelling of mineralised horizon
Section 8806700
(looking north)
3x vert ical exaggeration
1450
1350
3 RESOURCE MODELLING
3.1 Initial models
Initial modelling in 2009 utilised just 46 drillholes on a 400 m to 800 m spacing, with the mineralised horizon defined using a 1% Cu cut-off, with a minimum 3 m downhole thickness to
ensure the mineralised horizon could be considered mineable utilising underground methods.
In low grade areas, where the 1% cut-off was <3 m, the interval was diluted to 3 m to introduce lateral dilution into the model. Drillholes were composited across the full mineralised
interval to define a single average value per drillhole.
A 100 m by 100 m block model was created within the modelling limits and draped onto a
surface modelled using trend-surface analysis within individual fault blocks, whereby a firstor second-order polynomial trend surface was fitted to the drill data, and the residuals from
this surface modelled using two-dimensional inverse distance squared (ID2) weighting. Copper
grade was back-calculated from estimates of true thickness and metal accumulation (Cu% * true
thickness), also using ID2 at a datum elevation. When used at Kakula, density weighting was
also applied as the higher grades materially impacted the density. A single block was defined
in the vertical orientation, with the block height set to the estimated vertical thickness (Fig. 3).
This two dimensional (2D) gridded seam model approach is commonly used in earlystage projects with limited and wide-spaced drilling. The approach was continued through a
number of updates. Advantages to this approach include:
– File sizes are very small and easy to use
– Estimation is rapid
– Grade trends can be easily plotted without the need for further post-processing
– They are well suited to early-stage engineering studies
The initial 2D approach used did have a number of disadvantages:
– The vertical grade profile and trend in sulphide species was lost when the full width composite (average value) was defined
– Mining heights were hard-coded into the mineralised horizon definition; no optimisation
of the vertical mining height was thus possible without the entire modelling process being
repeated at different cut-offs or minimum and/or maximum mining height considerations
– Trend surfacing to define the correct vertical position of blocks led to a dimpled surface and ‘drag’ folds developing along faults as, away from data, the surface continually
returned to the regionally defined trend.
Figure 3. Two dimensional model in the correct three dimensional space, but with only a single block
defining the mineralized horizon.
ft
~
8
1450
0 0 518
00708
0 0695
1350
100
200
metres
~
8
00716
0 0 317
0 0662
legend
Pyritic Siltstone (KPS)
•
Diamictite
•
R4.2 sandsto ne
~
8
00506
00742
Kamoa Deposit
(2Dmodel)
I
Modelling of mineralised horizon
Section 8806700
(looking north)
3x vert ical exaggeration
1450
1350