

190
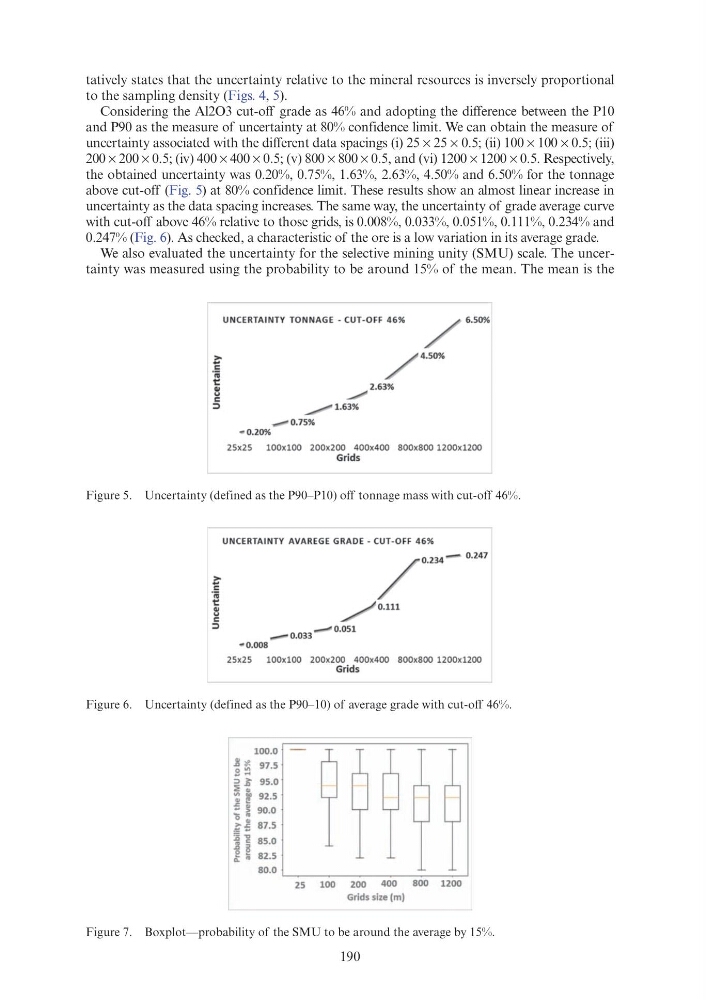
Figure 5. Uncertainty (defined as the P90–P10) off tonnage mass with cut-off 46%.
tatively states that the uncertainty relative to the mineral resources is inversely proportional
to the sampling density (Figs. 4, 5).
Considering the Al2O3 cut-off grade as 46% and adopting the difference between the P10
and P90 as the measure of uncertainty at 80% confidence limit. We can obtain the measure of
uncertainty associated with the different data spacings (i) 25 × 25 × 0.5; (ii) 100 × 100 × 0.5; (iii)
200 × 200 × 0.5; (iv) 400 × 400 × 0.5; (v) 800 × 800 × 0.5, and (vi) 1200 × 1200 × 0.5. Respectively,
the obtained uncertainty was 0.20%, 0.75%, 1.63%, 2.63%, 4.50% and 6.50% for the tonnage
above cut-off (Fig. 5) at 80% confidence limit. These results show an almost linear increase in
uncertainty as the data spacing increases. The same way, the uncertainty of grade average curve
with cut-off above 46% relative to those grids, is 0.008%, 0.033%, 0.051%, 0.111%, 0.234% and
0.247% (Fig. 6). As checked, a characteristic of the ore is a low variation in its average grade.
We also evaluated the uncertainty for the selective mining unity (SMU) scale. The uncertainty was measured using the probability to be around 15% of the mean. The mean is the
Figure 6. Uncertainty (defined as the P90–10) of average grade with cut-off 46%.
Figure 7. Boxplot—probability of the SMU to be around the average by 15%.
~
c
·n;
1::
.. ... c
:::l
UNCERTAINTY TONNAGE -CUT-OFF 46%
/
6.50%
/
4 .50%
.. 0.20%
~ 2.63%
__,.. 1.63%
,..... o.75%
25x25
l OOxlOO 200x200 4 00x400 800x800 1200x1200
Grids
UNCERTAINTY AVAREGE GRADE- CUT- OFF 46%
/ ' ·=-"' "
. . /0.111
-
0.033
........ 0.051
.. 0.008
25x25
lOOxl OO 200x200 400x4 00 800x800 1200x1200
Grids
25
100
200
400
800 1200
Grids size (m)
Figure 5. Uncertainty (defined as the P90–P10) off tonnage mass with cut-off 46%.
tatively states that the uncertainty relative to the mineral resources is inversely proportional
to the sampling density (Figs. 4, 5).
Considering the Al2O3 cut-off grade as 46% and adopting the difference between the P10
and P90 as the measure of uncertainty at 80% confidence limit. We can obtain the measure of
uncertainty associated with the different data spacings (i) 25 × 25 × 0.5; (ii) 100 × 100 × 0.5; (iii)
200 × 200 × 0.5; (iv) 400 × 400 × 0.5; (v) 800 × 800 × 0.5, and (vi) 1200 × 1200 × 0.5. Respectively,
the obtained uncertainty was 0.20%, 0.75%, 1.63%, 2.63%, 4.50% and 6.50% for the tonnage
above cut-off (Fig. 5) at 80% confidence limit. These results show an almost linear increase in
uncertainty as the data spacing increases. The same way, the uncertainty of grade average curve
with cut-off above 46% relative to those grids, is 0.008%, 0.033%, 0.051%, 0.111%, 0.234% and
0.247% (Fig. 6). As checked, a characteristic of the ore is a low variation in its average grade.
We also evaluated the uncertainty for the selective mining unity (SMU) scale. The uncertainty was measured using the probability to be around 15% of the mean. The mean is the
Figure 6. Uncertainty (defined as the P90–10) of average grade with cut-off 46%.
Figure 7. Boxplot—probability of the SMU to be around the average by 15%.
~
c
·n;
1::
.. ... c
:::l
UNCERTAINTY TONNAGE -CUT-OFF 46%
/
6.50%
/
4 .50%
.. 0.20%
~ 2.63%
__,.. 1.63%
,..... o.75%
25x25
l OOxlOO 200x200 4 00x400 800x800 1200x1200
Grids
UNCERTAINTY AVAREGE GRADE- CUT- OFF 46%
/ ' ·=-"' "
. . /0.111
-
0.033
........ 0.051
.. 0.008
25x25
lOOxl OO 200x200 400x4 00 800x800 1200x1200
Grids
25
100
200
400
800 1200
Grids size (m)