

189
the tonnage above the cut-off grade of the deposit decreases. Conversely, as the cut-off grade
is lowered, the tonnage of the deposit increases. This is simply because the standard used to
distinguish between ore and waste has become less selective. As the cut-off grade increases, so
does the average grade of the ore mined. The curves ultimately show how the average grade and
tonnage of a material delivered to a certain process are dependent on the cut-off grade selected.
Grade-tonnage curves are applicable throughout various stages of deposit evaluation.
During exploration, for example, they can be a significant tool used to estimate the general
size of a resource in tons of metal, using exploration data to generate the estimates. The
grade and tonnage data used to create the curves are compiled with several assumptions,
which should be taken into consideration when using the curves. Such assumptions are that
the deposit is correctly classified, the data represents the complete in situ resource. Certain
sources of error that can be prevalent when creating the curves include mixed geological
environments, which may also be poorly known, the use of multiple mining methods, and
incomplete estimates/errors in data recording.
3.8 Summarize uncertainty measures
The size of the band formed by the spreading of the grade-tonnage curves is a qualitative
measure of the uncertainty associated to the mineral resources. Thus, the narrower the band
formed by the scattering of these curves, the lower the uncertainty; in turn, the wider the
band, the greater the uncertainty.
Cut-off grade is the minimum grade required in order for a mineral or metal to be economically mined (or processed). Material found to be above this grade is considered to be
ore, while material below this grade is considered to be waste. By setting a value cut-off in
the grade-Tonnage curve, it is obtained the value of the tonnage and average content for that
cut-off. Thus, it is possible to identify in a quantitative way the degree of uncertainty coming
from the resources simulations. Various measures are used to summarize like the standard
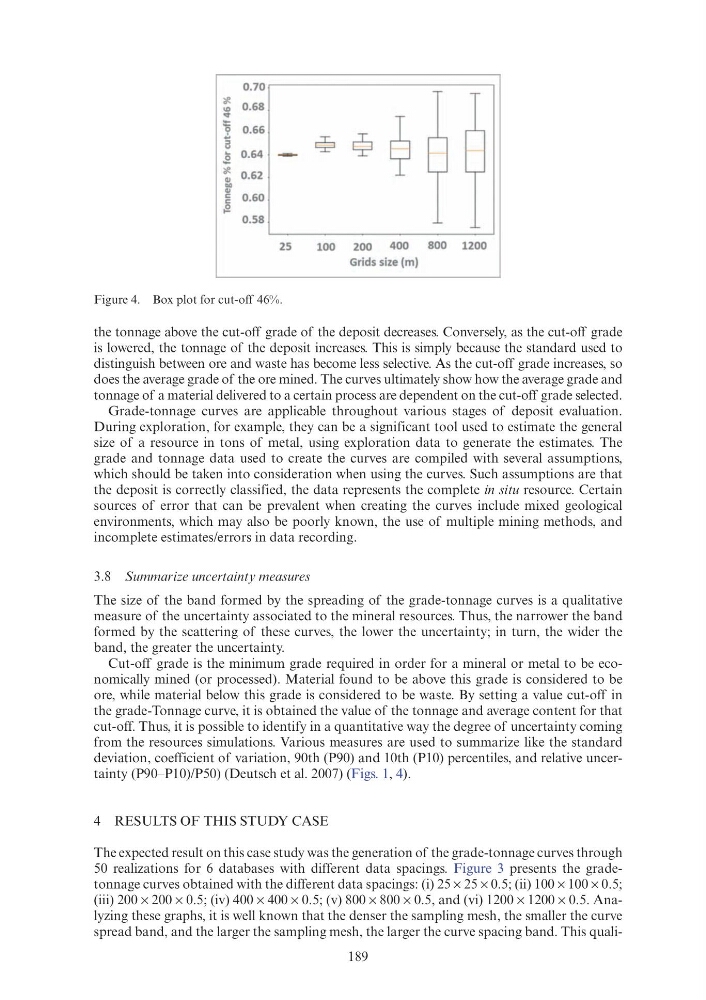
deviation, coefficient of variation, 90th (P90) and 10th (P10) percentiles, and relative uncertainty (P90–P10)/P50) (Deutsch et al. 2007) (Figs. 1, 4).
4 RESULTS OF THIS STUDY CASE
The expected result on this case study was the generation of the grade-tonnage curves through
50 realizations for 6 databases with different data spacings. Figure 3 presents the gradetonnage curves obtained with the different data spacings: (i) 25 × 25 × 0.5; (ii) 100 × 100 × 0.5;
(iii) 200 × 200 × 0.5; (iv) 400 × 400 × 0.5; (v) 800 × 800 × 0.5, and (vi) 1200 × 1200 × 0.5. Analyzing these graphs, it is well known that the denser the sampling mesh, the smaller the curve
spread band, and the larger the sampling mesh, the larger the curve spacing band. This qualiFigure 4. Box plot for cut-off 46%.
0.70
* 0.68
"' o:t
~
0.66
9 ~
:::1
~ ~
u
~
0.64
-
~
* 0.62
"' ""
"' c: 0.60
c:
~ 0.58
25
100
200
400
800 1200
Grids size (m)
the tonnage above the cut-off grade of the deposit decreases. Conversely, as the cut-off grade
is lowered, the tonnage of the deposit increases. This is simply because the standard used to
distinguish between ore and waste has become less selective. As the cut-off grade increases, so
does the average grade of the ore mined. The curves ultimately show how the average grade and
tonnage of a material delivered to a certain process are dependent on the cut-off grade selected.
Grade-tonnage curves are applicable throughout various stages of deposit evaluation.
During exploration, for example, they can be a significant tool used to estimate the general
size of a resource in tons of metal, using exploration data to generate the estimates. The
grade and tonnage data used to create the curves are compiled with several assumptions,
which should be taken into consideration when using the curves. Such assumptions are that
the deposit is correctly classified, the data represents the complete in situ resource. Certain
sources of error that can be prevalent when creating the curves include mixed geological
environments, which may also be poorly known, the use of multiple mining methods, and
incomplete estimates/errors in data recording.
3.8 Summarize uncertainty measures
The size of the band formed by the spreading of the grade-tonnage curves is a qualitative
measure of the uncertainty associated to the mineral resources. Thus, the narrower the band
formed by the scattering of these curves, the lower the uncertainty; in turn, the wider the
band, the greater the uncertainty.
Cut-off grade is the minimum grade required in order for a mineral or metal to be economically mined (or processed). Material found to be above this grade is considered to be
ore, while material below this grade is considered to be waste. By setting a value cut-off in
the grade-Tonnage curve, it is obtained the value of the tonnage and average content for that
cut-off. Thus, it is possible to identify in a quantitative way the degree of uncertainty coming
from the resources simulations. Various measures are used to summarize like the standard
deviation, coefficient of variation, 90th (P90) and 10th (P10) percentiles, and relative uncertainty (P90–P10)/P50) (Deutsch et al. 2007) (Figs. 1, 4).
4 RESULTS OF THIS STUDY CASE
The expected result on this case study was the generation of the grade-tonnage curves through
50 realizations for 6 databases with different data spacings. Figure 3 presents the gradetonnage curves obtained with the different data spacings: (i) 25 × 25 × 0.5; (ii) 100 × 100 × 0.5;
(iii) 200 × 200 × 0.5; (iv) 400 × 400 × 0.5; (v) 800 × 800 × 0.5, and (vi) 1200 × 1200 × 0.5. Analyzing these graphs, it is well known that the denser the sampling mesh, the smaller the curve
spread band, and the larger the sampling mesh, the larger the curve spacing band. This qualiFigure 4. Box plot for cut-off 46%.
0.70
* 0.68
"' o:t
~
0.66
9 ~
:::1
~ ~
u
~
0.64
-
~
* 0.62
"' ""
"' c: 0.60
c:
~ 0.58
25
100
200
400
800 1200
Grids size (m)