

183
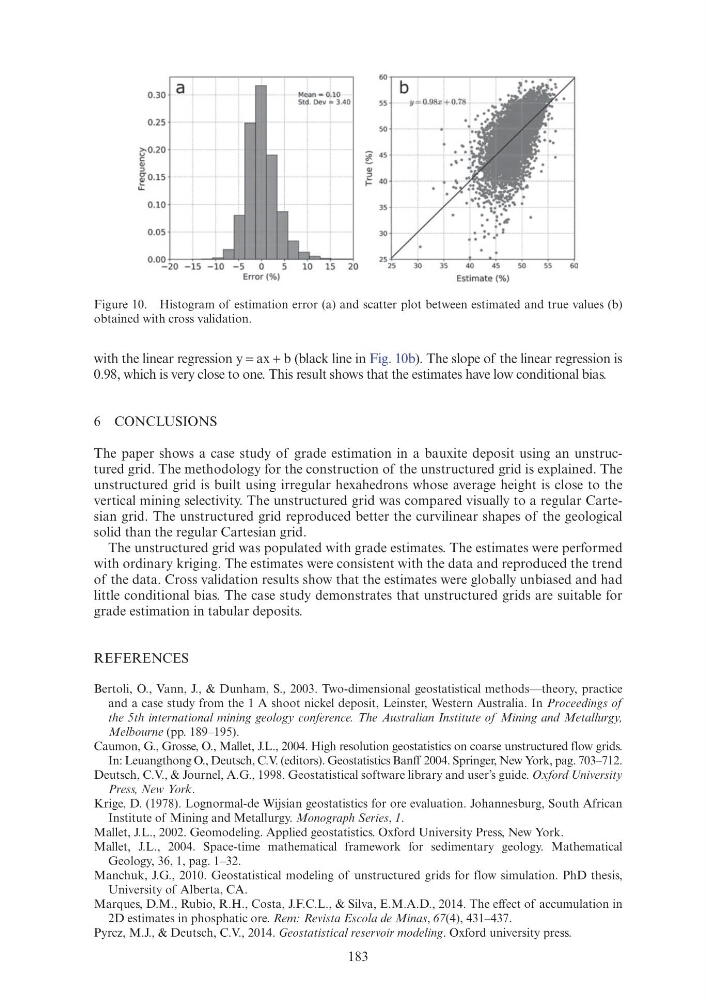
with the linear regression y = ax + b (black line in Fig. 10b). The slope of the linear regression is
0.98, which is very close to one. This result shows that the estimates have low conditional bias.
6 CONCLUSIONS
The paper shows a case study of grade estimation in a bauxite deposit using an unstructured grid. The methodology for the construction of the unstructured grid is explained. The
unstructured grid is built using irregular hexahedrons whose average height is close to the
vertical mining selectivity. The unstructured grid was compared visually to a regular Cartesian grid. The unstructured grid reproduced better the curvilinear shapes of the geological
solid than the regular Cartesian grid.
The unstructured grid was populated with grade estimates. The estimates were performed
with ordinary kriging. The estimates were consistent with the data and reproduced the trend
of the data. Cross validation results show that the estimates were globally unbiased and had
little conditional bias. The case study demonstrates that unstructured grids are suitable for
grade estimation in tabular deposits.
REFERENCES
Bertoli, O., Vann, J., & Dunham, S., 2003. Two-dimensional geostatistical methods—theory, practice
and a case study from the 1 A shoot nickel deposit, Leinster, Western Australia. In Proceedings of
the 5th international mining geology conference. The Australian Institute of Mining and Metallurgy,
Melbourne (pp. 189–195).
Caumon, G., Grosse, O., Mallet, J.L., 2004. High resolution geostatistics on coarse unstructured flow grids.
In: Leuangthong O., Deutsch, C.V. (editors). Geostatistics Banff 2004. Springer, New York, pag. 703–712.
Deutsch, C.V., & Journel, A.G., 1998. Geostatistical software library and user’s guide. Oxford University
Press, New York.
Krige, D. (1978). Lognormal-de Wijsian geostatistics for ore evaluation. Johannesburg, South African
Institute of Mining and Metallurgy. Monograph Series, 1.
Mallet, J.L., 2002. Geomodeling. Applied geostatistics. Oxford University Press, New York.
Mallet, J.L., 2004. Space-time mathematical framework for sedimentary geology. Mathematical
Geology, 36, 1, pag. 1–32.
Manchuk, J.G., 2010. Geostatistical modeling of unstructured grids for flow simulation. PhD thesis,
University of Alberta, CA.
Marques, D.M., Rubio, R.H., Costa, J.F.C.L., & Silva, E.M.A.D., 2014. The effect of accumulation in
2D estimates in phosphatic ore. Rem: Revista Escola de Minas, 67(4), 431–437.
Pyrcz, M.J., & Deutsch, C.V., 2014. Geostatistical reservoir modeling. Oxford university press.
Figure 10. Histogram of estimation error (a) and scatter plot between estimated and true values (b)
obtained with cross validation.
o.3o a
;
---r-- --+---0.25
(i0.20
c:
Q)
::>
fO.lS
0.10
'
:
:
:
--------t--------t-------+--:
1
------~;
-----~--------L __
!
i
. +
r r
;
-- ---! ---- Mean- =- 0~ 10 -
Std. Dev ~ 3.40
.
'
'
'
-----1--------+--------r--------~
I , - - - - - - - - - , - - - - - - - - - , -
•
;
o.o5 -------r·-----+~H-~ --~~---FI----I--'1-fb.-------r-------o.oo
-20 -15 -10 -5
0
5
10 15 20
Error(%)
60
55
so
~
45
Q)
::>
t= 40
35
30
Estimate (% )
with the linear regression y = ax + b (black line in Fig. 10b). The slope of the linear regression is
0.98, which is very close to one. This result shows that the estimates have low conditional bias.
6 CONCLUSIONS
The paper shows a case study of grade estimation in a bauxite deposit using an unstructured grid. The methodology for the construction of the unstructured grid is explained. The
unstructured grid is built using irregular hexahedrons whose average height is close to the
vertical mining selectivity. The unstructured grid was compared visually to a regular Cartesian grid. The unstructured grid reproduced better the curvilinear shapes of the geological
solid than the regular Cartesian grid.
The unstructured grid was populated with grade estimates. The estimates were performed
with ordinary kriging. The estimates were consistent with the data and reproduced the trend
of the data. Cross validation results show that the estimates were globally unbiased and had
little conditional bias. The case study demonstrates that unstructured grids are suitable for
grade estimation in tabular deposits.
REFERENCES
Bertoli, O., Vann, J., & Dunham, S., 2003. Two-dimensional geostatistical methods—theory, practice
and a case study from the 1 A shoot nickel deposit, Leinster, Western Australia. In Proceedings of
the 5th international mining geology conference. The Australian Institute of Mining and Metallurgy,
Melbourne (pp. 189–195).
Caumon, G., Grosse, O., Mallet, J.L., 2004. High resolution geostatistics on coarse unstructured flow grids.
In: Leuangthong O., Deutsch, C.V. (editors). Geostatistics Banff 2004. Springer, New York, pag. 703–712.
Deutsch, C.V., & Journel, A.G., 1998. Geostatistical software library and user’s guide. Oxford University
Press, New York.
Krige, D. (1978). Lognormal-de Wijsian geostatistics for ore evaluation. Johannesburg, South African
Institute of Mining and Metallurgy. Monograph Series, 1.
Mallet, J.L., 2002. Geomodeling. Applied geostatistics. Oxford University Press, New York.
Mallet, J.L., 2004. Space-time mathematical framework for sedimentary geology. Mathematical
Geology, 36, 1, pag. 1–32.
Manchuk, J.G., 2010. Geostatistical modeling of unstructured grids for flow simulation. PhD thesis,
University of Alberta, CA.
Marques, D.M., Rubio, R.H., Costa, J.F.C.L., & Silva, E.M.A.D., 2014. The effect of accumulation in
2D estimates in phosphatic ore. Rem: Revista Escola de Minas, 67(4), 431–437.
Pyrcz, M.J., & Deutsch, C.V., 2014. Geostatistical reservoir modeling. Oxford university press.
Figure 10. Histogram of estimation error (a) and scatter plot between estimated and true values (b)
obtained with cross validation.
o.3o a
;
---r-- --+---0.25
(i0.20
c:
Q)
::>
fO.lS
0.10
'
:
:
:
--------t--------t-------+--:
1
------~;
-----~--------L __
!
i
. +
r r
;
-- ---! ---- Mean- =- 0~ 10 -
Std. Dev ~ 3.40
.
'
'
'
-----1--------+--------r--------~
I , - - - - - - - - - , - - - - - - - - - , -
•
;
o.o5 -------r·-----+~H-~ --~~---FI----I--'1-fb.-------r-------o.oo
-20 -15 -10 -5
0
5
10 15 20
Error(%)
60
55
so
~
45
Q)
::>
t= 40
35
30
Estimate (% )