

178
using ordinary kriging. The grade model was checked by visual inspection, swath plots, and
cross validation.
2 DATA SET PRESENTATION
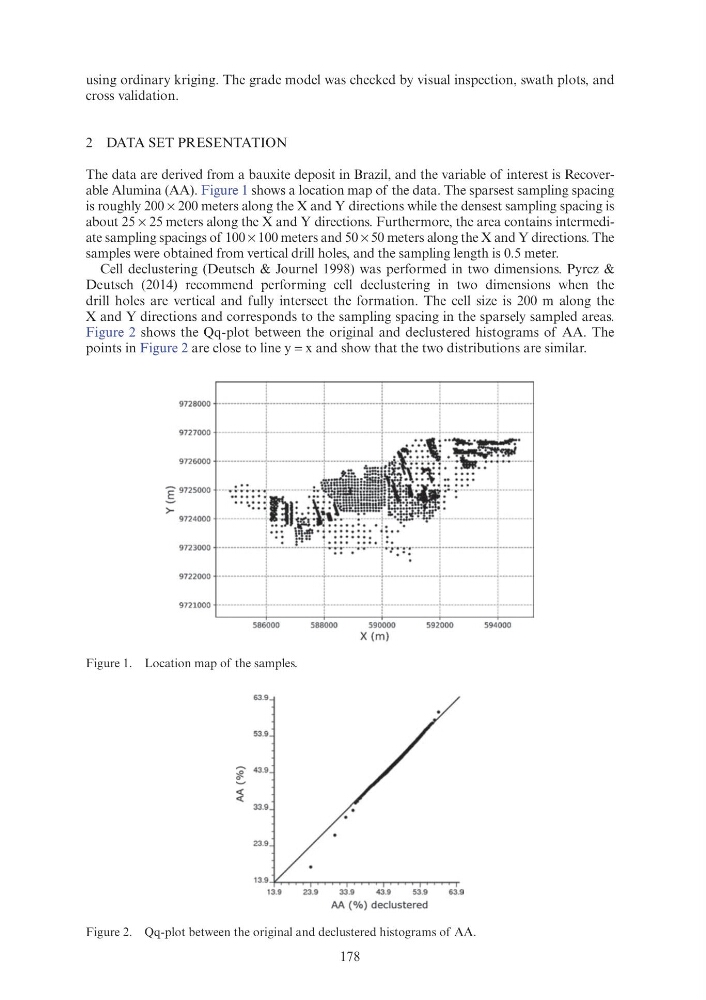
The data are derived from a bauxite deposit in Brazil, and the variable of interest is Recoverable Alumina (AA). Figure 1 shows a location map of the data. The sparsest sampling spacing
is roughly 200 × 200 meters along the X and Y directions while the densest sampling spacing is
about 25 × 25 meters along the X and Y directions. Furthermore, the area contains intermediate sampling spacings of 100 × 100 meters and 50 × 50 meters along the X and Y directions. The
samples were obtained from vertical drill holes, and the sampling length is 0.5 meter.
Cell declustering (Deutsch & Journel 1998) was performed in two dimensions. Pyrcz &
Deutsch (2014) recommend performing cell declustering in two dimensions when the
drill holes are vertical and fully intersect the formation. The cell size is 200 m along the
X and Y directions and corresponds to the sampling spacing in the sparsely sampled areas.
Figure 2 shows the Qq-plot between the original and declustered histograms of AA. The
points in Figure 2 are close to line y = x and show that the two distributions are similar.
Figure 1. Location map of the samples.
Figure 2. Qq-plot between the original and declustered histograms of AA.
9728000
9727000
9726000
E' 9725ooo
>- 9724000
9723000
9722000
9721000
-12.
~
~
...
586000
63.9
53.9
43.9
33.9
23.9
588000
590000
X(m)
592000
1 3 .9--j<-,,.....-......-..,-.-....... ..,-.-......... ,....,....,,.......,........,"""
13.9
23.9
33.9
43.9
53.9
63.9
AA (%) declustered
594000
using ordinary kriging. The grade model was checked by visual inspection, swath plots, and
cross validation.
2 DATA SET PRESENTATION
The data are derived from a bauxite deposit in Brazil, and the variable of interest is Recoverable Alumina (AA). Figure 1 shows a location map of the data. The sparsest sampling spacing
is roughly 200 × 200 meters along the X and Y directions while the densest sampling spacing is
about 25 × 25 meters along the X and Y directions. Furthermore, the area contains intermediate sampling spacings of 100 × 100 meters and 50 × 50 meters along the X and Y directions. The
samples were obtained from vertical drill holes, and the sampling length is 0.5 meter.
Cell declustering (Deutsch & Journel 1998) was performed in two dimensions. Pyrcz &
Deutsch (2014) recommend performing cell declustering in two dimensions when the
drill holes are vertical and fully intersect the formation. The cell size is 200 m along the
X and Y directions and corresponds to the sampling spacing in the sparsely sampled areas.
Figure 2 shows the Qq-plot between the original and declustered histograms of AA. The
points in Figure 2 are close to line y = x and show that the two distributions are similar.
Figure 1. Location map of the samples.
Figure 2. Qq-plot between the original and declustered histograms of AA.
9728000
9727000
9726000
E' 9725ooo
>- 9724000
9723000
9722000
9721000
-12.
~
~
...
586000
63.9
53.9
43.9
33.9
23.9
588000
590000
X(m)
592000
1 3 .9--j<-,,.....-......-..,-.-....... ..,-.-......... ,....,....,,.......,........,"""
13.9
23.9
33.9
43.9
53.9
63.9
AA (%) declustered
594000