

174
variance map. Variograms: horizontal and vertical experimental variograms over the TI, GT
and each realization are compared, providing a measure of the two-points statistics. Binary
proportion (BP): the number of channel nodes (pixels) over the total number of nodes in
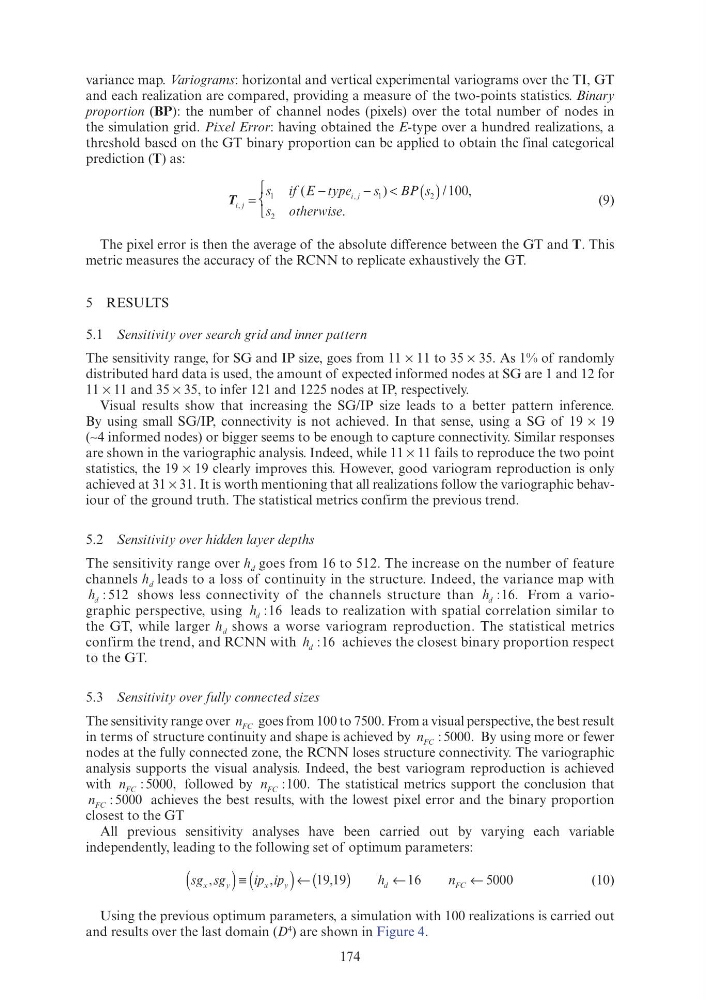
the simulation grid. Pixel Error: having obtained the E-type over a hundred realizations, a
threshold based on the GT binary proportion can be applied to obtain the final categorical
prediction (T) as:
T i j
T T
i j
s if E
i
BP
s otherwise i i
)
E type
s
/
,
.
=
type
( )
s
⎧
⎨
⎧ ⎧
⎩
⎨ ⎨
1
1
i j
if E
i
y i j
E type
s
2
(9)
The pixel error is then the average of the absolute difference between the GT and T. This
metric measures the accuracy of the RCNN to replicate exhaustively the GT.
5 RESULTS
5.1 Sensitivity over search grid and inner pattern
The sensitivity range, for SG and IP size, goes from 11 × 11 to 35 × 35. As 1% of randomly
distributed hard data is used, the amount of expected informed nodes at SG are 1 and 12 for
11 × 11 and 35 × 35, to infer 121 and 1225 nodes at IP, respectively.
Visual results show that increasing the SG/IP size leads to a better pattern inference.
By using small SG/IP, connectivity is not achieved. In that sense, using a SG of 19 × 19
(∼4 informed nodes) or bigger seems to be enough to capture connectivity. Similar responses
are shown in the variographic analysis. Indeed, while 11 × 11 fails to reproduce the two point
statistics, the 19 × 19 clearly improves this. However, good variogram reproduction is only
achieved at 31 × 31. It is worth mentioning that all realizations follow the variographic behaviour of the ground truth. The statistical metrics confirm the previous trend.
5.2 Sensitivity over hidden layer depths
The sensitivity range over h d goes from 16 to 512. The increase on the number of feature
channels h d leads to a loss of continuity in the structure. Indeed, the variance map with
h d
h : 512 shows less connectivity of the channels structure than h d
h : .
16 From a variographic perspective, using h d
h :16 leads to realization with spatial correlation similar to
the GT, while larger h d shows a worse variogram reproduction. The statistical metrics
confirm the trend, and RCNN with h d
h :16 achieves the closest binary proportion respect
to the GT.
5.3 Sensitivity over fully connected sizes
The sensitivity range over n FC goes from 100 to 7500. From a visual perspective, the best result
in terms of structure continuity and shape is achieved by n FC :
.
5000 By using more or fewer
nodes at the fully connected zone, the RCNN loses structure connectivity. The variographic
analysis supports the visual analysis. Indeed, the best variogram reproduction is achieved
with n FC :
,
5000 followed by n FC :
.
100 The statistical metrics support the conclusion that
n FC : 5000 achieves the best results, with the lowest pixel error and the binary proportion
closest to the GT
All previous sensitivity analyses have been carried out by varying each variable
independently, leading to the following set of optimum parameters:
sg sg
ip ip
h
n
x
y
g
x
y
ip
d
F
h
C
,
ip x
,sg y
sg
(
) ≡ (
) ← ( )
,
←
n F
n C
5000
(10)
Using the previous optimum parameters, a simulation with 100 realizations is carried out
and results over the last domain (D
4
) are shown in Figure 4.
variance map. Variograms: horizontal and vertical experimental variograms over the TI, GT
and each realization are compared, providing a measure of the two-points statistics. Binary
proportion (BP): the number of channel nodes (pixels) over the total number of nodes in
the simulation grid. Pixel Error: having obtained the E-type over a hundred realizations, a
threshold based on the GT binary proportion can be applied to obtain the final categorical
prediction (T) as:
T i j
T T
i j
s if E
i
BP
s otherwise i i
)
E type
s
/
,
.
=
type
( )
s
⎧
⎨
⎧ ⎧
⎩
⎨ ⎨
1
1
i j
if E
i
y i j
E type
s
2
(9)
The pixel error is then the average of the absolute difference between the GT and T. This
metric measures the accuracy of the RCNN to replicate exhaustively the GT.
5 RESULTS
5.1 Sensitivity over search grid and inner pattern
The sensitivity range, for SG and IP size, goes from 11 × 11 to 35 × 35. As 1% of randomly
distributed hard data is used, the amount of expected informed nodes at SG are 1 and 12 for
11 × 11 and 35 × 35, to infer 121 and 1225 nodes at IP, respectively.
Visual results show that increasing the SG/IP size leads to a better pattern inference.
By using small SG/IP, connectivity is not achieved. In that sense, using a SG of 19 × 19
(∼4 informed nodes) or bigger seems to be enough to capture connectivity. Similar responses
are shown in the variographic analysis. Indeed, while 11 × 11 fails to reproduce the two point
statistics, the 19 × 19 clearly improves this. However, good variogram reproduction is only
achieved at 31 × 31. It is worth mentioning that all realizations follow the variographic behaviour of the ground truth. The statistical metrics confirm the previous trend.
5.2 Sensitivity over hidden layer depths
The sensitivity range over h d goes from 16 to 512. The increase on the number of feature
channels h d leads to a loss of continuity in the structure. Indeed, the variance map with
h d
h : 512 shows less connectivity of the channels structure than h d
h : .
16 From a variographic perspective, using h d
h :16 leads to realization with spatial correlation similar to
the GT, while larger h d shows a worse variogram reproduction. The statistical metrics
confirm the trend, and RCNN with h d
h :16 achieves the closest binary proportion respect
to the GT.
5.3 Sensitivity over fully connected sizes
The sensitivity range over n FC goes from 100 to 7500. From a visual perspective, the best result
in terms of structure continuity and shape is achieved by n FC :
.
5000 By using more or fewer
nodes at the fully connected zone, the RCNN loses structure connectivity. The variographic
analysis supports the visual analysis. Indeed, the best variogram reproduction is achieved
with n FC :
,
5000 followed by n FC :
.
100 The statistical metrics support the conclusion that
n FC : 5000 achieves the best results, with the lowest pixel error and the binary proportion
closest to the GT
All previous sensitivity analyses have been carried out by varying each variable
independently, leading to the following set of optimum parameters:
sg sg
ip ip
h
n
x
y
g
x
y
ip
d
F
h
C
,
ip x
,sg y
sg
(
) ≡ (
) ← ( )
,
←
n F
n C
5000
(10)
Using the previous optimum parameters, a simulation with 100 realizations is carried out
and results over the last domain (D
4
) are shown in Figure 4.