

150
Selective Mining Units (SMUs) for OP and UG mining. The ore body in the block model is
irregularly shaped with a total mineral resource of 116.10 Mt at an average Cu grade of 1.05%,
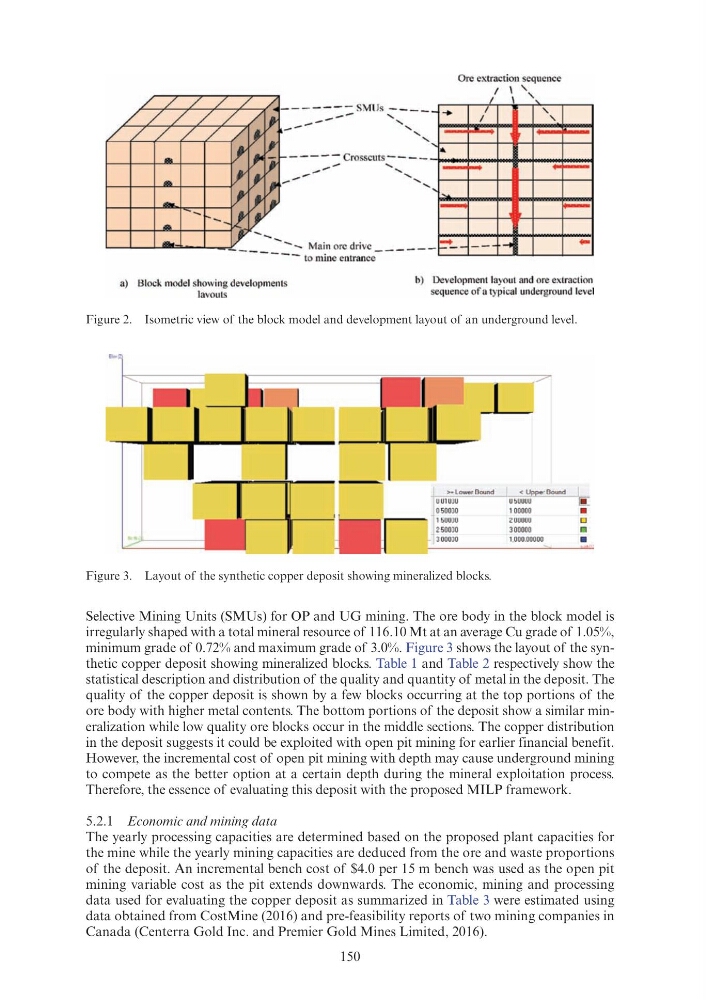
minimum grade of 0.72% and maximum grade of 3.0%. Figure 3 shows the layout of the synthetic copper deposit showing mineralized blocks. Table 1 and Table 2 respectively show the
statistical description and distribution of the quality and quantity of metal in the deposit. The
quality of the copper deposit is shown by a few blocks occurring at the top portions of the
ore body with higher metal contents. The bottom portions of the deposit show a similar mineralization while low quality ore blocks occur in the middle sections. The copper distribution
in the deposit suggests it could be exploited with open pit mining for earlier financial benefit.
However, the incremental cost of open pit mining with depth may cause underground mining
to compete as the better option at a certain depth during the mineral exploitation process.
Therefore, the essence of evaluating this deposit with the proposed MILP framework.
5.2.1 Economic and mining data
The yearly processing capacities are determined based on the proposed plant capacities for
the mine while the yearly mining capacities are deduced from the ore and waste proportions
of the deposit. An incremental bench cost of $4.0 per 15 m bench was used as the open pit
mining variable cost as the pit extends downwards. The economic, mining and processing
data used for evaluating the copper deposit as summarized in Table 3 were estimated using
data obtained from CostMine (2016) and pre-feasibility reports of two mining companies in
Canada (Centerra Gold Inc. and Premier Gold Mines Limited, 2016).
Figure 2. Isometric view of the block model and development layout of an underground level.
Figure 3. Layout of the synthetic copper deposit showing mineralized blocks.
Ore extraction sequence
I I '
' '
I
'
- - - - - - - SNfl Js - - - -
-- ' --.. I
'
I
'
-' ' ' '
- - - - - Crosscuts - - - -
...... ----- ................... ........
'
Main ore drive _____ _
- - - to mine entrance
~
..
1....
... ~
1 -
~
~ - -- ·-f
-
a) Block model showing developments
lavouts
b) Development layout and ore extraction
sequence of a typical underground level
, .. Lower Bound
< Uppe· Bound
I_
U !:IUUOO
]: 1~1(
1 00000
•
200000
D
300000
1_000.0000 0
•
Selective Mining Units (SMUs) for OP and UG mining. The ore body in the block model is
irregularly shaped with a total mineral resource of 116.10 Mt at an average Cu grade of 1.05%,
minimum grade of 0.72% and maximum grade of 3.0%. Figure 3 shows the layout of the synthetic copper deposit showing mineralized blocks. Table 1 and Table 2 respectively show the
statistical description and distribution of the quality and quantity of metal in the deposit. The
quality of the copper deposit is shown by a few blocks occurring at the top portions of the
ore body with higher metal contents. The bottom portions of the deposit show a similar mineralization while low quality ore blocks occur in the middle sections. The copper distribution
in the deposit suggests it could be exploited with open pit mining for earlier financial benefit.
However, the incremental cost of open pit mining with depth may cause underground mining
to compete as the better option at a certain depth during the mineral exploitation process.
Therefore, the essence of evaluating this deposit with the proposed MILP framework.
5.2.1 Economic and mining data
The yearly processing capacities are determined based on the proposed plant capacities for
the mine while the yearly mining capacities are deduced from the ore and waste proportions
of the deposit. An incremental bench cost of $4.0 per 15 m bench was used as the open pit
mining variable cost as the pit extends downwards. The economic, mining and processing
data used for evaluating the copper deposit as summarized in Table 3 were estimated using
data obtained from CostMine (2016) and pre-feasibility reports of two mining companies in
Canada (Centerra Gold Inc. and Premier Gold Mines Limited, 2016).
Figure 2. Isometric view of the block model and development layout of an underground level.
Figure 3. Layout of the synthetic copper deposit showing mineralized blocks.
Ore extraction sequence
I I '
' '
I
'
- - - - - - - SNfl Js - - - -
-- ' --.. I
'
I
'
-' ' ' '
- - - - - Crosscuts - - - -
...... ----- ................... ........
'
Main ore drive _____ _
- - - to mine entrance
~
..
1....
... ~
1 -
~
~ - -- ·-f
-
a) Block model showing developments
lavouts
b) Development layout and ore extraction
sequence of a typical underground level
, .. Lower Bound
< Uppe· Bound
I_
U !:IUUOO
]: 1~1(
1 00000
•
200000
D
300000
1_000.0000 0
•