

139
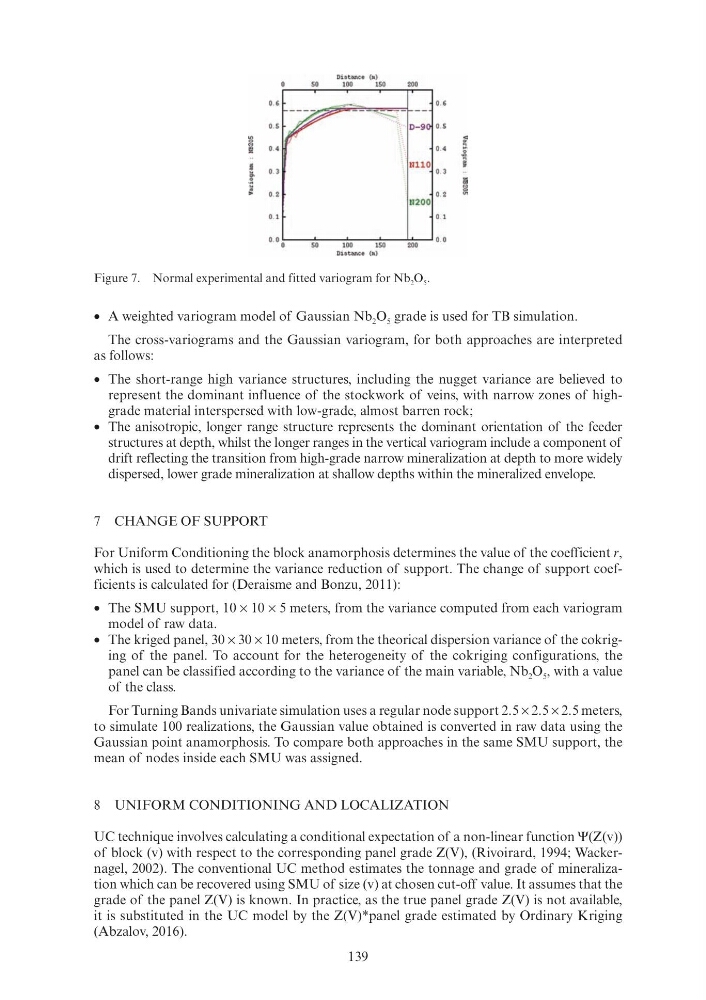
• A weighted variogram model of Gaussian Nb 2 O 5 grade is used for TB simulation.
The cross-variograms and the Gaussian variogram, for both approaches are interpreted
as follows:
• The short-range high variance structures, including the nugget variance are believed to
represent the dominant influence of the stockwork of veins, with narrow zones of highgrade material interspersed with low-grade, almost barren rock;
• The anisotropic, longer range structure represents the dominant orientation of the feeder
structures at depth, whilst the longer ranges in the vertical variogram include a component of
drift reflecting the transition from high-grade narrow mineralization at depth to more widely
dispersed, lower grade mineralization at shallow depths within the mineralized envelope.
7 CHANGE OF SUPPORT
For Uniform Conditioning the block anamorphosis determines the value of the coefficient r,
which is used to determine the variance reduction of support. The change of support coefficients is calculated for (Deraisme and Bonzu, 2011):
• The SMU support, 10 × 10 × 5 meters, from the variance computed from each variogram
model of raw data.
• The kriged panel, 30 × 30 × 10 meters, from the theorical dispersion variance of the cokriging of the panel. To account for the heterogeneity of the cokriging configurations, the
panel can be classified according to the variance of the main variable, Nb 2 O 5 , with a value
of the class.
For Turning Bands univariate simulation uses a regular node support 2.5 × 2.5 × 2.5 meters,
to simulate 100 realizations, the Gaussian value obtained is converted in raw data using the
Gaussian point anamorphosis. To compare both approaches in the same SMU support, the
mean of nodes inside each SMU was assigned.
8 UNIFORM CONDITIONING AND LOCALIZATION
UC technique involves calculating a conditional expectation of a non-linear function Ψ(Z(v))
of block (v) with respect to the corresponding panel grade Z(V), (Rivoirard, 1994; Wackernagel, 2002). The conventional UC method estimates the tonnage and grade of mineralization which can be recovered using SMU of size (v) at chosen cut-off value. It assumes that the
grade of the panel Z(V) is known. In practice, as the true panel grade Z(V) is not available,
it is substituted in the UC model by the Z(V)*panel grade estimated by Ordinary Kriging
(Abzalov, 2016).
Figure 7. Normal experimental and fitted variogram for Nb 2 O 5 .
Dis t ance (•)
50
100
150
200
0. 6
-- ~,, - -·t··. D-9 0. 5
'B
~
~
0. 4
0. 4
'
NllO
i
.~
0. 3
0. 3
~
~
0. 2
0. 2
*
N200
0. 1
0. 1
0. 0
0. 0
0
50
100
150
200
Dis t ance (•)
• A weighted variogram model of Gaussian Nb 2 O 5 grade is used for TB simulation.
The cross-variograms and the Gaussian variogram, for both approaches are interpreted
as follows:
• The short-range high variance structures, including the nugget variance are believed to
represent the dominant influence of the stockwork of veins, with narrow zones of highgrade material interspersed with low-grade, almost barren rock;
• The anisotropic, longer range structure represents the dominant orientation of the feeder
structures at depth, whilst the longer ranges in the vertical variogram include a component of
drift reflecting the transition from high-grade narrow mineralization at depth to more widely
dispersed, lower grade mineralization at shallow depths within the mineralized envelope.
7 CHANGE OF SUPPORT
For Uniform Conditioning the block anamorphosis determines the value of the coefficient r,
which is used to determine the variance reduction of support. The change of support coefficients is calculated for (Deraisme and Bonzu, 2011):
• The SMU support, 10 × 10 × 5 meters, from the variance computed from each variogram
model of raw data.
• The kriged panel, 30 × 30 × 10 meters, from the theorical dispersion variance of the cokriging of the panel. To account for the heterogeneity of the cokriging configurations, the
panel can be classified according to the variance of the main variable, Nb 2 O 5 , with a value
of the class.
For Turning Bands univariate simulation uses a regular node support 2.5 × 2.5 × 2.5 meters,
to simulate 100 realizations, the Gaussian value obtained is converted in raw data using the
Gaussian point anamorphosis. To compare both approaches in the same SMU support, the
mean of nodes inside each SMU was assigned.
8 UNIFORM CONDITIONING AND LOCALIZATION
UC technique involves calculating a conditional expectation of a non-linear function Ψ(Z(v))
of block (v) with respect to the corresponding panel grade Z(V), (Rivoirard, 1994; Wackernagel, 2002). The conventional UC method estimates the tonnage and grade of mineralization which can be recovered using SMU of size (v) at chosen cut-off value. It assumes that the
grade of the panel Z(V) is known. In practice, as the true panel grade Z(V) is not available,
it is substituted in the UC model by the Z(V)*panel grade estimated by Ordinary Kriging
(Abzalov, 2016).
Figure 7. Normal experimental and fitted variogram for Nb 2 O 5 .
Dis t ance (•)
50
100
150
200
0. 6
-- ~,, - -·t··. D-9 0. 5
'B
~
~
0. 4
0. 4
'
NllO
i
.~
0. 3
0. 3
~
~
0. 2
0. 2
*
N200
0. 1
0. 1
0. 0
0. 0
0
50
100
150
200
Dis t ance (•)