

137
This study assumes that both datasets will be used together to perform further estimates.
These grade control data are considered very desirable for assessing the semivariance at short
ranges, however most of the grade control drilling is located in and around the nelsonite
veins and it is comparatively high-grade relative to material that has been intersected within
the core zone of the complex.
The principal element of interest is Nb 2 O 5 . The secondary ones are Fe 2 O 3 and TiO 2 because
these are related to nelsonite mineralization and have some significance for metallurgical
recovery processes. In order to represent the correlation between those elements, a multivariate Localized Uniform Conditions (MLUC) is applied in order to reproduce the correlation
between the variables.
Prior to attempting any variography, the Nb 2 O 5 data within the Fresh Rock domain
were subjected to a de-clustering analysis using a moving windows process. All Fresh rock
data were declustered using an isotropic cube-shaped window. Within Figure 3, there is a
local ‘plateau’ within the decluster curve corresponding to a window size of approximately
15 m × 15 m × 15 m (step 15). The data were declustered at this window size and decluster
weights were calculated and stored. This plateau is interpreted to represent the removal of a
local and small-scale cluster effect that is a consequence of the close-spaced grade control data.
5 NORMAL SCORE AND GAUSSIAN ANAMORPHOSIS
As the discrete Gaussian model (DGM) for change of support is part of the UC workflow, it
is necessary to test the applicability of DGM. Checking ratios of grade indicator variograms
can theoretically test the applicability of the diffusive mode (Rivoirard, 1994). The common
‘diffusion model’ is one in which higher grade zones transcend into low grade zones through
intermediate grades. This model has so been called ‘edge effects’ and it is the most common
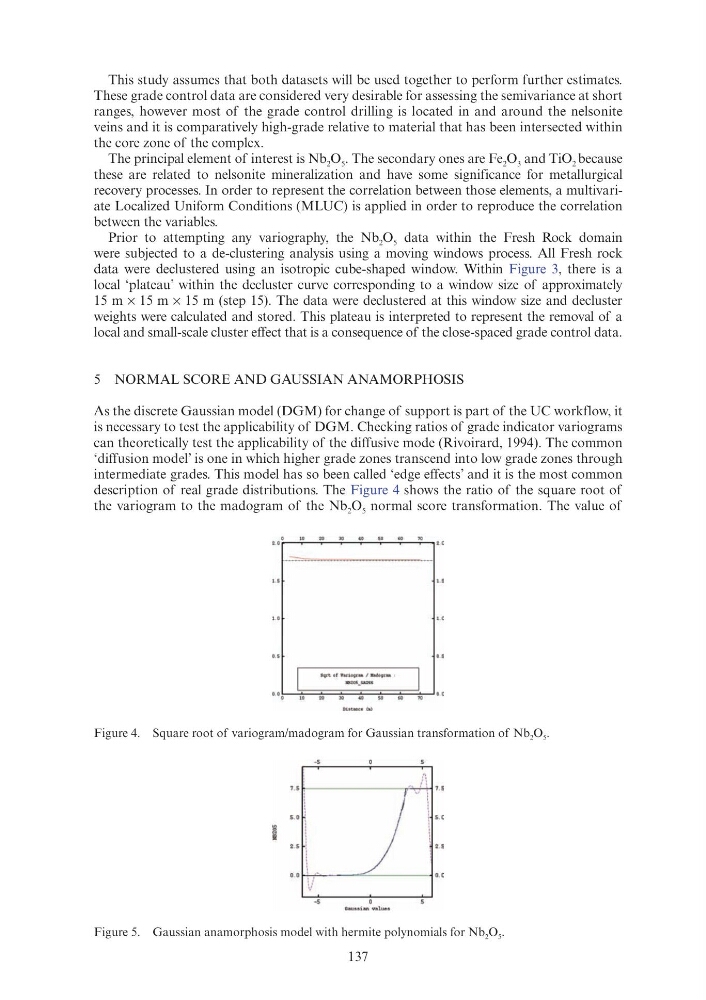
description of real grade distributions. The Figure 4 shows the ratio of the square root of
the variogram to the madogram of the Nb 2 O 5 normal score transformation. The value of
Figure 4. Square root of variogram/madogram for Gaussian transformation of Nb 2 O 5 .
Figure 5. Gaussian anamorphosis model with hermite polynomials for Nb 2 O 5 .
7 . 5
5 . 0
I
2 . 5
0 0 \./
-5
Sqrt of Variognm I l!a do
Di &tance (ll)
)
Gaueeian value~
/\ 7. 5
"
5 . 0
2. 5
00
This study assumes that both datasets will be used together to perform further estimates.
These grade control data are considered very desirable for assessing the semivariance at short
ranges, however most of the grade control drilling is located in and around the nelsonite
veins and it is comparatively high-grade relative to material that has been intersected within
the core zone of the complex.
The principal element of interest is Nb 2 O 5 . The secondary ones are Fe 2 O 3 and TiO 2 because
these are related to nelsonite mineralization and have some significance for metallurgical
recovery processes. In order to represent the correlation between those elements, a multivariate Localized Uniform Conditions (MLUC) is applied in order to reproduce the correlation
between the variables.
Prior to attempting any variography, the Nb 2 O 5 data within the Fresh Rock domain
were subjected to a de-clustering analysis using a moving windows process. All Fresh rock
data were declustered using an isotropic cube-shaped window. Within Figure 3, there is a
local ‘plateau’ within the decluster curve corresponding to a window size of approximately
15 m × 15 m × 15 m (step 15). The data were declustered at this window size and decluster
weights were calculated and stored. This plateau is interpreted to represent the removal of a
local and small-scale cluster effect that is a consequence of the close-spaced grade control data.
5 NORMAL SCORE AND GAUSSIAN ANAMORPHOSIS
As the discrete Gaussian model (DGM) for change of support is part of the UC workflow, it
is necessary to test the applicability of DGM. Checking ratios of grade indicator variograms
can theoretically test the applicability of the diffusive mode (Rivoirard, 1994). The common
‘diffusion model’ is one in which higher grade zones transcend into low grade zones through
intermediate grades. This model has so been called ‘edge effects’ and it is the most common
description of real grade distributions. The Figure 4 shows the ratio of the square root of
the variogram to the madogram of the Nb 2 O 5 normal score transformation. The value of
Figure 4. Square root of variogram/madogram for Gaussian transformation of Nb 2 O 5 .
Figure 5. Gaussian anamorphosis model with hermite polynomials for Nb 2 O 5 .
7 . 5
5 . 0
I
2 . 5
0 0 \./
-5
Sqrt of Variognm I l!a do
Di &tance (ll)
)
Gaueeian value~
/\ 7. 5
"
5 . 0
2. 5
00