

121
Figure 4 shows the comparison of the Indicated category panels from the kriging based
approach (Figure 4a, reproduced from Figure 3a) and the simulation approach (Figure 4b).
Overall, more panels are assigned to the Indicated category than defined from either the drill hole
spacing or from the kriging approach. This result indicates that, in this case study, the assignment
to the Indicated category from drill hole spacing was conservative, in the sense that it would not
be necessary for additional in-fill drilling in the center of the deposit. More specifically, the simulation approach resulted in 20% increase of the volume assigned to the Indicated category.
4 PRECISE ALLOCATION OF ADDITIONAL DRILL HOLES
With progressively more localized assessments of drill hole spacing requirements comes the
ability to extend the simulation approach to further the planning of the next drill campaign.
Specifically, the simulation methodology provides a much more precise assessment of necessary
infill drilling, with a suggested location of the infill drill holes, for upgrading from Inferred to
Indicated category. This is an important question at the forefront of most drill campaigns as a
mining exploration project advances from pre-feasibility to feasibility and development.
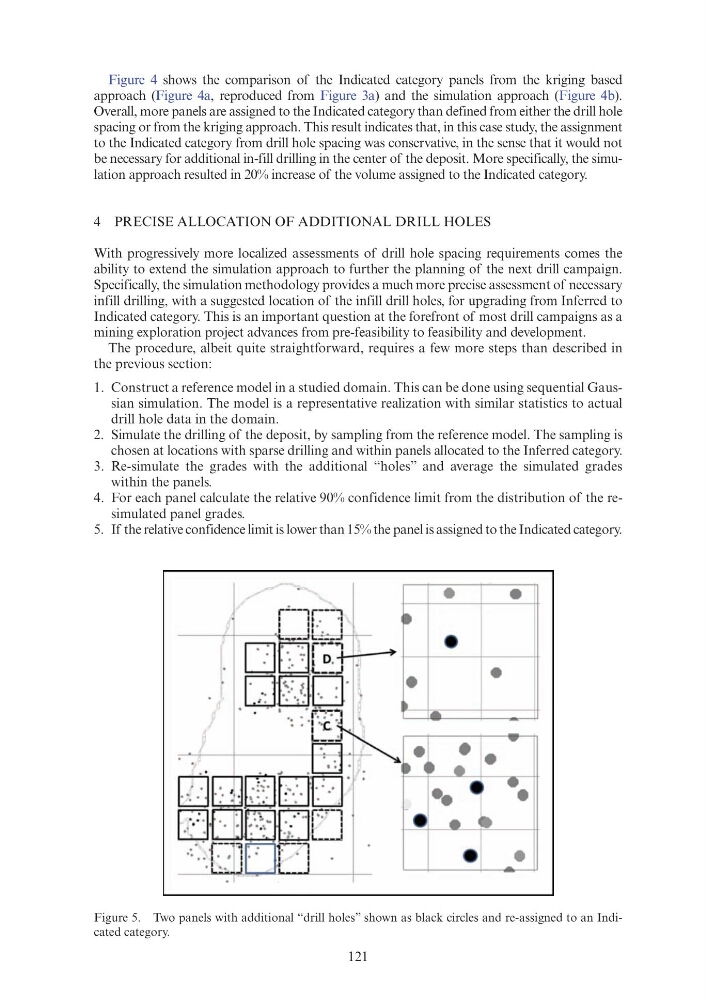
The procedure, albeit quite straightforward, requires a few more steps than described in
the previous section:
1. Construct a reference model in a studied domain. This can be done using sequential Gaussian simulation. The model is a representative realization with similar statistics to actual
drill hole data in the domain.
2. Simulate the drilling of the deposit, by sampling from the reference model. The sampling is
chosen at locations with sparse drilling and within panels allocated to the Inferred category.
3. Re-simulate the grades with the additional “holes” and average the simulated grades
within the panels.
4. For each panel calculate the relative 90% confidence limit from the distribution of the resimulated panel grades.
5. If the relative confidence limit is lower than 15% the panel is assigned to the Indicated category.
Figure 5. Two panels with additional “drill holes” shown as black circles and re-assigned to an Indicated category.
Figure 4 shows the comparison of the Indicated category panels from the kriging based
approach (Figure 4a, reproduced from Figure 3a) and the simulation approach (Figure 4b).
Overall, more panels are assigned to the Indicated category than defined from either the drill hole
spacing or from the kriging approach. This result indicates that, in this case study, the assignment
to the Indicated category from drill hole spacing was conservative, in the sense that it would not
be necessary for additional in-fill drilling in the center of the deposit. More specifically, the simulation approach resulted in 20% increase of the volume assigned to the Indicated category.
4 PRECISE ALLOCATION OF ADDITIONAL DRILL HOLES
With progressively more localized assessments of drill hole spacing requirements comes the
ability to extend the simulation approach to further the planning of the next drill campaign.
Specifically, the simulation methodology provides a much more precise assessment of necessary
infill drilling, with a suggested location of the infill drill holes, for upgrading from Inferred to
Indicated category. This is an important question at the forefront of most drill campaigns as a
mining exploration project advances from pre-feasibility to feasibility and development.
The procedure, albeit quite straightforward, requires a few more steps than described in
the previous section:
1. Construct a reference model in a studied domain. This can be done using sequential Gaussian simulation. The model is a representative realization with similar statistics to actual
drill hole data in the domain.
2. Simulate the drilling of the deposit, by sampling from the reference model. The sampling is
chosen at locations with sparse drilling and within panels allocated to the Inferred category.
3. Re-simulate the grades with the additional “holes” and average the simulated grades
within the panels.
4. For each panel calculate the relative 90% confidence limit from the distribution of the resimulated panel grades.
5. If the relative confidence limit is lower than 15% the panel is assigned to the Indicated category.
Figure 5. Two panels with additional “drill holes” shown as black circles and re-assigned to an Indicated category.