

117
the data are paired over a series of lag distances. In an indicator variogram half of the average
of the squared differences between the “head” end and the “tail” end of the pair are calculated.
For a p-gram, only those pairs for which the tail is in ore, i.e. with an indicator one, are considered. For each p-gram lag the proportion of pairs, with head and tail equal to one, i.e., that start
and finish in ore is determined. The higher the proportion, the greater continuity of the high
grade assays. The results, when plotted against the lag distance, represent the average probability that two samples separated by a particular lag distance will both be above the cut-off. The
plotted curve can be considered similar to a traditional correlogram in that it has a nugget, sill
and range. The range is the lag distance at which the curve levels off at the sill.
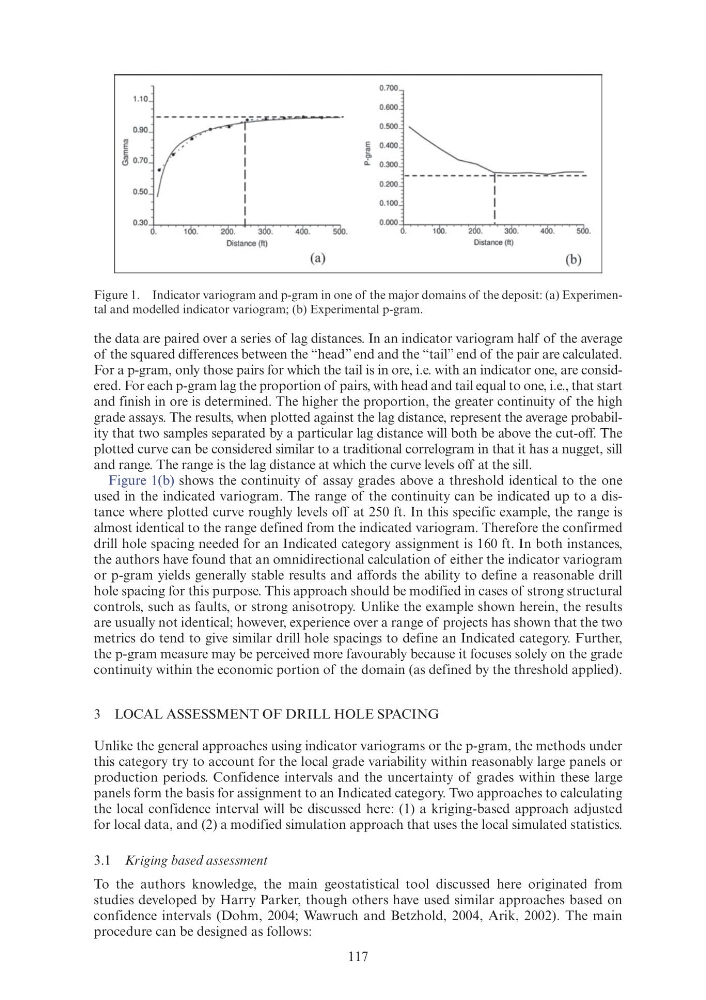
Figure 1(b) shows the continuity of assay grades above a threshold identical to the one
used in the indicated variogram. The range of the continuity can be indicated up to a distance where plotted curve roughly levels off at 250 ft. In this specific example, the range is
almost identical to the range defined from the indicated variogram. Therefore the confirmed
drill hole spacing needed for an Indicated category assignment is 160 ft. In both instances,
the authors have found that an omnidirectional calculation of either the indicator variogram
or p-gram yields generally stable results and affords the ability to define a reasonable drill
hole spacing for this purpose. This approach should be modified in cases of strong structural
controls, such as faults, or strong anisotropy. Unlike the example shown herein, the results
are usually not identical; however, experience over a range of projects has shown that the two
metrics do tend to give similar drill hole spacings to define an Indicated category. Further,
the p-gram measure may be perceived more favourably because it focuses solely on the grade
continuity within the economic portion of the domain (as defined by the threshold applied).
3 LOCAL ASSESSMENT OF DRILL HOLE SPACING
Unlike the general approaches using indicator variograms or the p-gram, the methods under
this category try to account for the local grade variability within reasonably large panels or
production periods. Confidence intervals and the uncertainty of grades within these large
panels form the basis for assignment to an Indicated category. Two approaches to calculating
the local confidence interval will be discussed here: (1) a kriging-based approach adjusted
for local data, and (2) a modified simulation approach that uses the local simulated statistics.
3.1 Kriging based assessment
To the authors knowledge, the main geostatistical tool discussed here originated from
studies developed by Harry Parker, though others have used similar approaches based on
confidence intervals (Dohm, 2004; Wawruch and Betzhold, 2004, Arik, 2002). The main
procedure can be designed as follows:
Figure 1. Indicator variogram and p-gram in one of the major domains of the deposit: (a) Experimental and modelled indicator variogram; (b) Experimental p-gram.
"'
E
E
1.10
0.90
~ 0.70
0.50
Dis1ance (h)
(a)
0.700
0.600
0.500
E 0.400
a,
d.. 0.300
0.200
0.100
___________ l ___________ _
I
I
I
Distance (ft)
(b)
the data are paired over a series of lag distances. In an indicator variogram half of the average
of the squared differences between the “head” end and the “tail” end of the pair are calculated.
For a p-gram, only those pairs for which the tail is in ore, i.e. with an indicator one, are considered. For each p-gram lag the proportion of pairs, with head and tail equal to one, i.e., that start
and finish in ore is determined. The higher the proportion, the greater continuity of the high
grade assays. The results, when plotted against the lag distance, represent the average probability that two samples separated by a particular lag distance will both be above the cut-off. The
plotted curve can be considered similar to a traditional correlogram in that it has a nugget, sill
and range. The range is the lag distance at which the curve levels off at the sill.
Figure 1(b) shows the continuity of assay grades above a threshold identical to the one
used in the indicated variogram. The range of the continuity can be indicated up to a distance where plotted curve roughly levels off at 250 ft. In this specific example, the range is
almost identical to the range defined from the indicated variogram. Therefore the confirmed
drill hole spacing needed for an Indicated category assignment is 160 ft. In both instances,
the authors have found that an omnidirectional calculation of either the indicator variogram
or p-gram yields generally stable results and affords the ability to define a reasonable drill
hole spacing for this purpose. This approach should be modified in cases of strong structural
controls, such as faults, or strong anisotropy. Unlike the example shown herein, the results
are usually not identical; however, experience over a range of projects has shown that the two
metrics do tend to give similar drill hole spacings to define an Indicated category. Further,
the p-gram measure may be perceived more favourably because it focuses solely on the grade
continuity within the economic portion of the domain (as defined by the threshold applied).
3 LOCAL ASSESSMENT OF DRILL HOLE SPACING
Unlike the general approaches using indicator variograms or the p-gram, the methods under
this category try to account for the local grade variability within reasonably large panels or
production periods. Confidence intervals and the uncertainty of grades within these large
panels form the basis for assignment to an Indicated category. Two approaches to calculating
the local confidence interval will be discussed here: (1) a kriging-based approach adjusted
for local data, and (2) a modified simulation approach that uses the local simulated statistics.
3.1 Kriging based assessment
To the authors knowledge, the main geostatistical tool discussed here originated from
studies developed by Harry Parker, though others have used similar approaches based on
confidence intervals (Dohm, 2004; Wawruch and Betzhold, 2004, Arik, 2002). The main
procedure can be designed as follows:
Figure 1. Indicator variogram and p-gram in one of the major domains of the deposit: (a) Experimental and modelled indicator variogram; (b) Experimental p-gram.
"'
E
E
1.10
0.90
~ 0.70
0.50
Dis1ance (h)
(a)
0.700
0.600
0.500
E 0.400
a,
d.. 0.300
0.200
0.100
___________ l ___________ _
I
I
I
Distance (ft)
(b)