

108
search so that I(θ) is a maximum, meaning that the projection is strongly non-Gaussian.
Once the maximum value of I(θ) is obtained the projected data X is Gaussianized leading
to X
* , so that the projection is univariate Gaussian. Then, the search begins once again, for
another maximum value of I(θ), and the data is once again Gaussianized, and so on. The
procedure is repeated until the data are multivariate Gaussian. The stopping criteria for the
PPMT algorithm is based on bootstrap sampling (Barnett et al., 2014) and (Manchuk et al.,
2017). Once the data are multivariate Gaussian the geostatistical modeling may proceed as
usual, independently for each projection obtained.
2.3 Back-transformation
The back-transformation is the reverse operation applied at each iteration in the Gaussianization process, so the more iterations performed on the forward transform the more reverse
operation performed on the back-transform. After all iterations have been reversed, the
sphering and normal score should be back-transformed (Manchuk et al., 2017).
3 COVARIANCE TABLE
Covariance table (CT) is a set of information that can be used to describe the spatial correlation in kriging and geostatistical simulation (Chu, 1993), (Deutsch and Journel, 1998), (Yao
and Journel, 1998), (Yao, 2004) and (Pyrcz and Deutsch, 2006). We propose to generate a CT
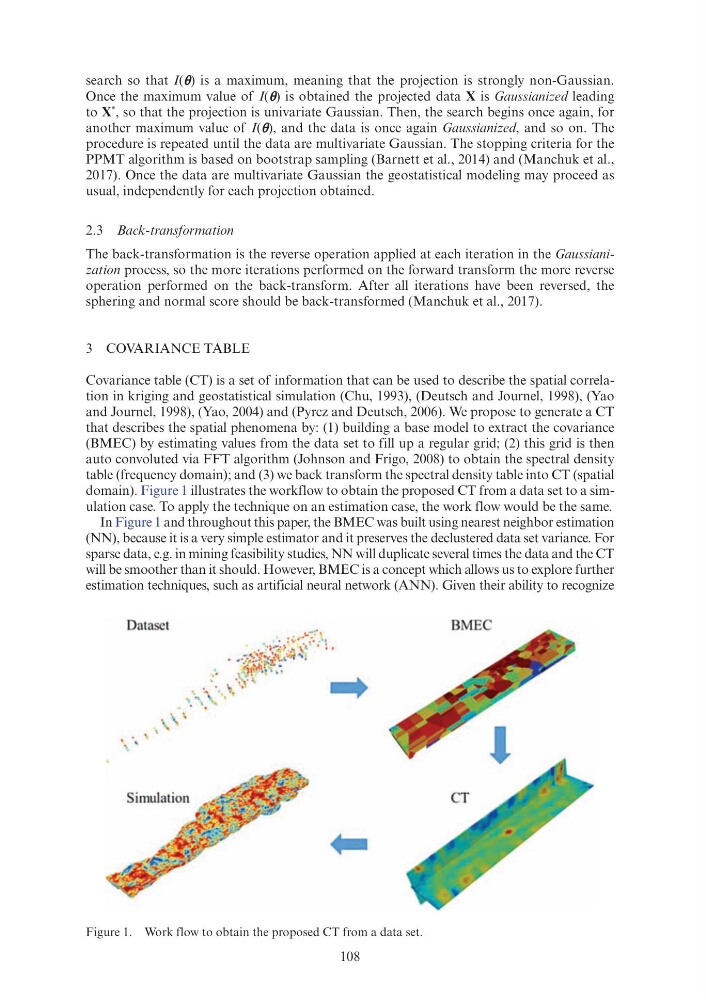
that describes the spatial phenomena by: (1) building a base model to extract the covariance
(BMEC) by estimating values from the data set to fill up a regular grid; (2) this grid is then
auto convoluted via FFT algorithm (Johnson and Frigo, 2008) to obtain the spectral density
table (frequency domain); and (3) we back transform the spectral density table into CT (spatial
domain). Figure 1 illustrates the workflow to obtain the proposed CT from a data set to a simulation case. To apply the technique on an estimation case, the work flow would be the same.
In Figure 1 and throughout this paper, the BMEC was built using nearest neighbor estimation
(NN), because it is a very simple estimator and it preserves the declustered data set variance. For
sparse data, e.g. in mining feasibility studies, NN will duplicate several times the data and the CT
will be smoother than it should. However, BMEC is a concept which allows us to explore further
estimation techniques, such as artificial neural network (ANN). Given their ability to recognize
Figure 1. Work flow to obtain the proposed CT from a data set.
Dataset
BMEC
, · ..
· '.
'
CT
...
search so that I(θ) is a maximum, meaning that the projection is strongly non-Gaussian.
Once the maximum value of I(θ) is obtained the projected data X is Gaussianized leading
to X
* , so that the projection is univariate Gaussian. Then, the search begins once again, for
another maximum value of I(θ), and the data is once again Gaussianized, and so on. The
procedure is repeated until the data are multivariate Gaussian. The stopping criteria for the
PPMT algorithm is based on bootstrap sampling (Barnett et al., 2014) and (Manchuk et al.,
2017). Once the data are multivariate Gaussian the geostatistical modeling may proceed as
usual, independently for each projection obtained.
2.3 Back-transformation
The back-transformation is the reverse operation applied at each iteration in the Gaussianization process, so the more iterations performed on the forward transform the more reverse
operation performed on the back-transform. After all iterations have been reversed, the
sphering and normal score should be back-transformed (Manchuk et al., 2017).
3 COVARIANCE TABLE
Covariance table (CT) is a set of information that can be used to describe the spatial correlation in kriging and geostatistical simulation (Chu, 1993), (Deutsch and Journel, 1998), (Yao
and Journel, 1998), (Yao, 2004) and (Pyrcz and Deutsch, 2006). We propose to generate a CT
that describes the spatial phenomena by: (1) building a base model to extract the covariance
(BMEC) by estimating values from the data set to fill up a regular grid; (2) this grid is then
auto convoluted via FFT algorithm (Johnson and Frigo, 2008) to obtain the spectral density
table (frequency domain); and (3) we back transform the spectral density table into CT (spatial
domain). Figure 1 illustrates the workflow to obtain the proposed CT from a data set to a simulation case. To apply the technique on an estimation case, the work flow would be the same.
In Figure 1 and throughout this paper, the BMEC was built using nearest neighbor estimation
(NN), because it is a very simple estimator and it preserves the declustered data set variance. For
sparse data, e.g. in mining feasibility studies, NN will duplicate several times the data and the CT
will be smoother than it should. However, BMEC is a concept which allows us to explore further
estimation techniques, such as artificial neural network (ANN). Given their ability to recognize
Figure 1. Work flow to obtain the proposed CT from a data set.
Dataset
BMEC
, · ..
· '.
'
CT
...