

88
3 METHODOLOGY
The methodology (Fig. 3) proposed in this study was applied using Aster multispectral data
for phosphate mapping purpose. Thus, a field campaign was firstly achieved in 2017 for
phosphate sampling. Thus, twenty five samples were gathered from the first 3 cm of ground
surface in the Chaketma site. Each sample was the subject of both mineralogical analysis and
reflectance measurement, after homogenization and quartering. The mineralogical analysis
was performed using a PANalytical X’Pert PRO X-ray Diffractometer. Thus, the mineralogical composition of each sample was identified and the percentage of different minerals was
determined. However, ground spectral measurements were taken under natural light on the
field with the ASD FieldSpec HiRes spectrometer (Analytical Spectral Devices, Boulder, Co.,
USA). This spectrometer was fitted with 10° field of view fiber optics and operated in the
350–2500 nm spectral regions with sampling intervals of 1 nm. The absolute reflectance factor for field measurements was provided by a white spectralon panel (5 × 5 cm). Thus, surface
reflectance measurements were taken at the 25 sites over each sample point location.
Moreover, multispectral data was pre-processed before phosphate mapping. Indeed, the
ASTER (Advanced Spaceborne Thermal Emission and Reflection) data, which was acquired
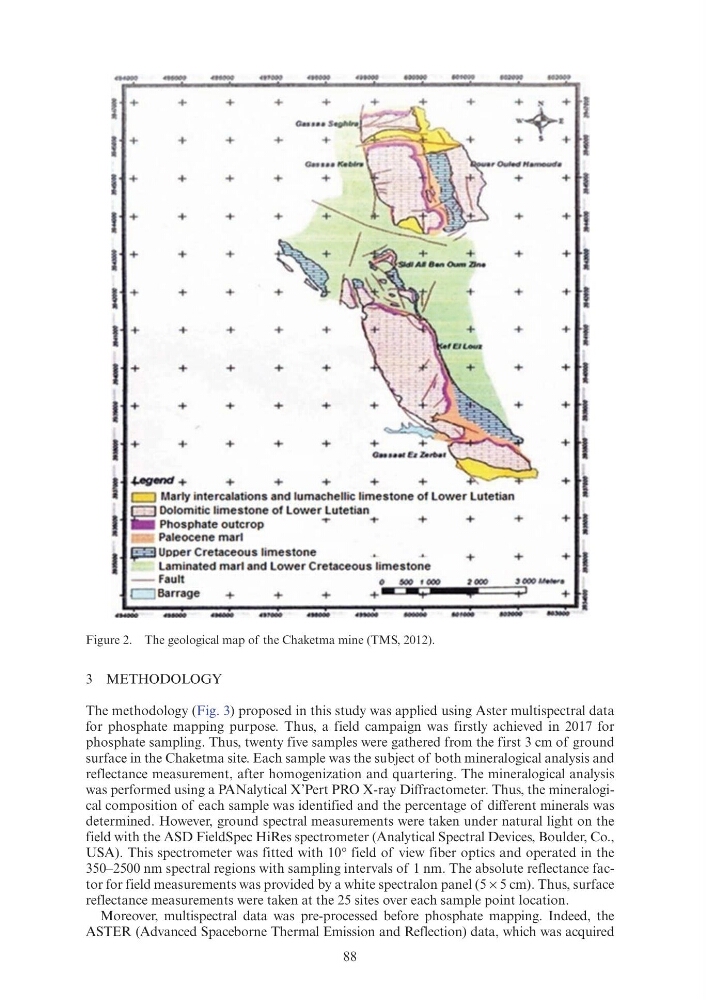
Figure 2. The geological map of the Chaketma mine (TMS, 2012).
- - -
- -
I
+
+
+
+
+
+
+
+
+
'
I
I
+
+
+
+
I
•
I
+
+
+
+
+
+
I
I
+
+
+
+
I
I
+
+
+
+
+
+
I
+
+
+
+
I
+
+
+
+
+
+
+
I
I
+
+
+
+
+
+
+
+
I
I
+
+
+
+
+
+
+
I
I
+
+
+
+
+
+
I
~+
+
+
+
+
+
+
Marty intercalations and lumachellic limestone of lower lutetian
jii Dolomitic limestone of lower lutet an
I
Phosphate outcrop
1'"
..+
+
+
+
Paleocene mar1
I
Upper Cretaceous limestone
+
+
+
I
laminated mar1 and lower Cretaceous limestone
- - Fault
0
-
ICOO
1 COO
lCOO
•
Barrage
+
+
+
+
+
I
- - - - - · - -
. . _ - -
3 METHODOLOGY
The methodology (Fig. 3) proposed in this study was applied using Aster multispectral data
for phosphate mapping purpose. Thus, a field campaign was firstly achieved in 2017 for
phosphate sampling. Thus, twenty five samples were gathered from the first 3 cm of ground
surface in the Chaketma site. Each sample was the subject of both mineralogical analysis and
reflectance measurement, after homogenization and quartering. The mineralogical analysis
was performed using a PANalytical X’Pert PRO X-ray Diffractometer. Thus, the mineralogical composition of each sample was identified and the percentage of different minerals was
determined. However, ground spectral measurements were taken under natural light on the
field with the ASD FieldSpec HiRes spectrometer (Analytical Spectral Devices, Boulder, Co.,
USA). This spectrometer was fitted with 10° field of view fiber optics and operated in the
350–2500 nm spectral regions with sampling intervals of 1 nm. The absolute reflectance factor for field measurements was provided by a white spectralon panel (5 × 5 cm). Thus, surface
reflectance measurements were taken at the 25 sites over each sample point location.
Moreover, multispectral data was pre-processed before phosphate mapping. Indeed, the
ASTER (Advanced Spaceborne Thermal Emission and Reflection) data, which was acquired
Figure 2. The geological map of the Chaketma mine (TMS, 2012).
- - -
- -
I
+
+
+
+
+
+
+
+
+
'
I
I
+
+
+
+
I
•
I
+
+
+
+
+
+
I
I
+
+
+
+
I
I
+
+
+
+
+
+
I
+
+
+
+
I
+
+
+
+
+
+
+
I
I
+
+
+
+
+
+
+
+
I
I
+
+
+
+
+
+
+
I
I
+
+
+
+
+
+
I
~+
+
+
+
+
+
+
Marty intercalations and lumachellic limestone of lower lutetian
jii Dolomitic limestone of lower lutet an
I
Phosphate outcrop
1'"
..+
+
+
+
Paleocene mar1
I
Upper Cretaceous limestone
+
+
+
I
laminated mar1 and lower Cretaceous limestone
- - Fault
0
-
ICOO
1 COO
lCOO
•
Barrage
+
+
+
+
+
I
- - - - - · - -
. . _ - -