

2 Computational Details
Calculations in vacuo were performed with fully relaxed geometry using two levels
of theory: Hartree-Fock (HF) with the 6-31G(d,p) basis set, and Density Functional
Theory (DFT) with the B3LYP functional [14, 15] and the 6-31+G(d,p) basis set.
HF is a moderately cheap quantum mechanical method which can yield accurate
information regarding conformational analysis. Previous studies on other molecules
[12, 16–18] showed that HF can successfully handle intramolecular H-bonding and
yields HOMO-LUMO energy gaps approaching those of experiments. DFT—an
alternate method to wavefunction approaches—is often used in conformational
search because it takes into account part of the correlation effects at a relatively low
cost. Among the numerous functionals available for the DFT framework, B3LYP
[14, 15, 19] is the most widely utilized; it can provide better quality results in
combination with basis sets containing diffuse functions, above all for molecular
systems containing IHBs [12, 16–18].
Harmonic vibrational frequencies were calculated in vacuo at the HF/6-31G(d,p)
level to verify that the stationary points from optimization results corresponded to
true minima and to obtain the zero-point energy (ZPE) corrections. The frequency
values were scaled by 0.9024 [20].
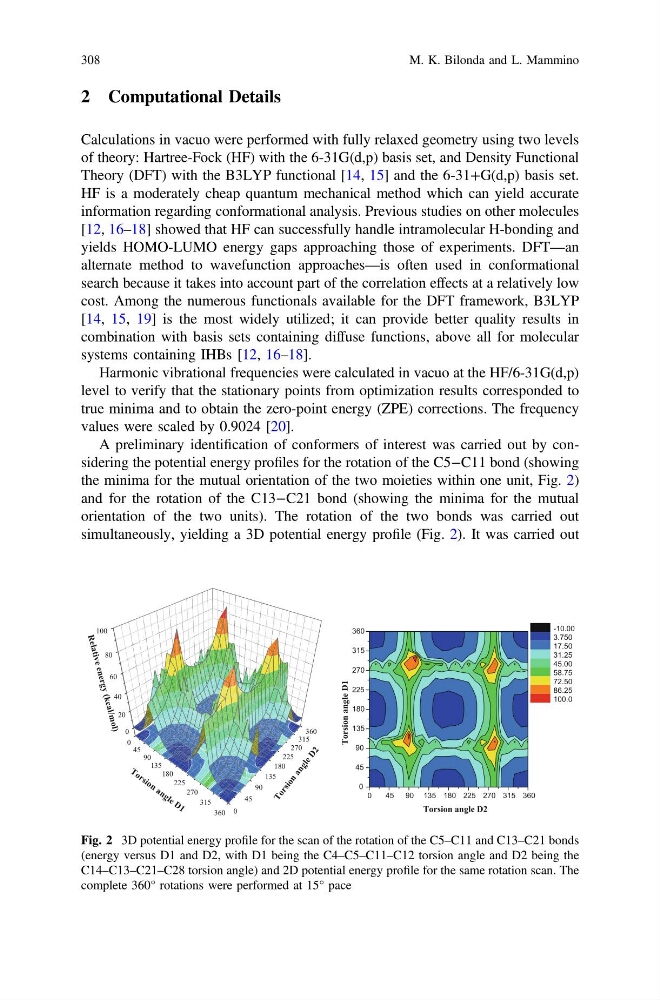
A preliminary identification of conformers of interest was carried out by considering the potential energy profiles for the rotation of the C5−C11 bond (showing
the minima for the mutual orientation of the two moieties within one unit, Fig. 2)
and for the rotation of the C13−C21 bond (showing the minima for the mutual
orientation of the two units). The rotation of the two bonds was carried out
simultaneously, yielding a 3D potential energy profile (Fig. 2). It was carried out
0
45
90
135
180
225
270
315
360
0
20
40
60
80
100
0
45
90
135
180
225
270
315
360
R
el
at
iv
e
en
er
gy
(k
ca
l/m
ol
)
T o r s i o n
a n g l e D 2
T o r s io n a n g l e D 1
0
45
90 135 180 225 270 315 360
0
45
90
135
180
225
270
315
360
-10.00
3.750
17.50
31.25
45.00
58.75
72.50
86.25
100.0
Torsion angle D2
Torsion angle D1
Fig. 2 3D potential energy profile for the scan of the rotation of the C5–C11 and C13–C21 bonds
(energy versus D1 and D2, with D1 being the C4–C5–C11–C12 torsion angle and D2 being the
C14–C13–C21–C28 torsion angle) and 2D potential energy profile for the same rotation scan. The
complete 360° rotations were performed at 15° pace
308
M. K. Bilonda and L. Mammino
Calculations in vacuo were performed with fully relaxed geometry using two levels
of theory: Hartree-Fock (HF) with the 6-31G(d,p) basis set, and Density Functional
Theory (DFT) with the B3LYP functional [14, 15] and the 6-31+G(d,p) basis set.
HF is a moderately cheap quantum mechanical method which can yield accurate
information regarding conformational analysis. Previous studies on other molecules
[12, 16–18] showed that HF can successfully handle intramolecular H-bonding and
yields HOMO-LUMO energy gaps approaching those of experiments. DFT—an
alternate method to wavefunction approaches—is often used in conformational
search because it takes into account part of the correlation effects at a relatively low
cost. Among the numerous functionals available for the DFT framework, B3LYP
[14, 15, 19] is the most widely utilized; it can provide better quality results in
combination with basis sets containing diffuse functions, above all for molecular
systems containing IHBs [12, 16–18].
Harmonic vibrational frequencies were calculated in vacuo at the HF/6-31G(d,p)
level to verify that the stationary points from optimization results corresponded to
true minima and to obtain the zero-point energy (ZPE) corrections. The frequency
values were scaled by 0.9024 [20].
A preliminary identification of conformers of interest was carried out by considering the potential energy profiles for the rotation of the C5−C11 bond (showing
the minima for the mutual orientation of the two moieties within one unit, Fig. 2)
and for the rotation of the C13−C21 bond (showing the minima for the mutual
orientation of the two units). The rotation of the two bonds was carried out
simultaneously, yielding a 3D potential energy profile (Fig. 2). It was carried out
0
45
90
135
180
225
270
315
360
0
20
40
60
80
100
0
45
90
135
180
225
270
315
360
R
el
at
iv
e
en
er
gy
(k
ca
l/m
ol
)
T o r s i o n
a n g l e D 2
T o r s io n a n g l e D 1
0
45
90 135 180 225 270 315 360
0
45
90
135
180
225
270
315
360
-10.00
3.750
17.50
31.25
45.00
58.75
72.50
86.25
100.0
Torsion angle D2
Torsion angle D1
Fig. 2 3D potential energy profile for the scan of the rotation of the C5–C11 and C13–C21 bonds
(energy versus D1 and D2, with D1 being the C4–C5–C11–C12 torsion angle and D2 being the
C14–C13–C21–C28 torsion angle) and 2D potential energy profile for the same rotation scan. The
complete 360° rotations were performed at 15° pace
308
M. K. Bilonda and L. Mammino