

Enhancement Factors for Positron Annihilation on Valence . . .
249
+
+
+
+
ε
ε
ν
μ 1
μ 2
n 1
ε ν
ε
n 2
n 2
μ 2
μ 1
n 1
ε
ε
μ 1 μ 2
ν
n 1 n 2
ε
ε
Γ
ε
μ 1
μ 2
n
ν 2
ν 1
ε
ν
ε
+
n
μ
ε
n 1
μ 2
μ 1
ν
ε
n 2
ε
ε
n 2
n 1
ν 2
ν 1
ε
μ
(a)
(b)
(c)
(d)
(e)
(f)
(g)
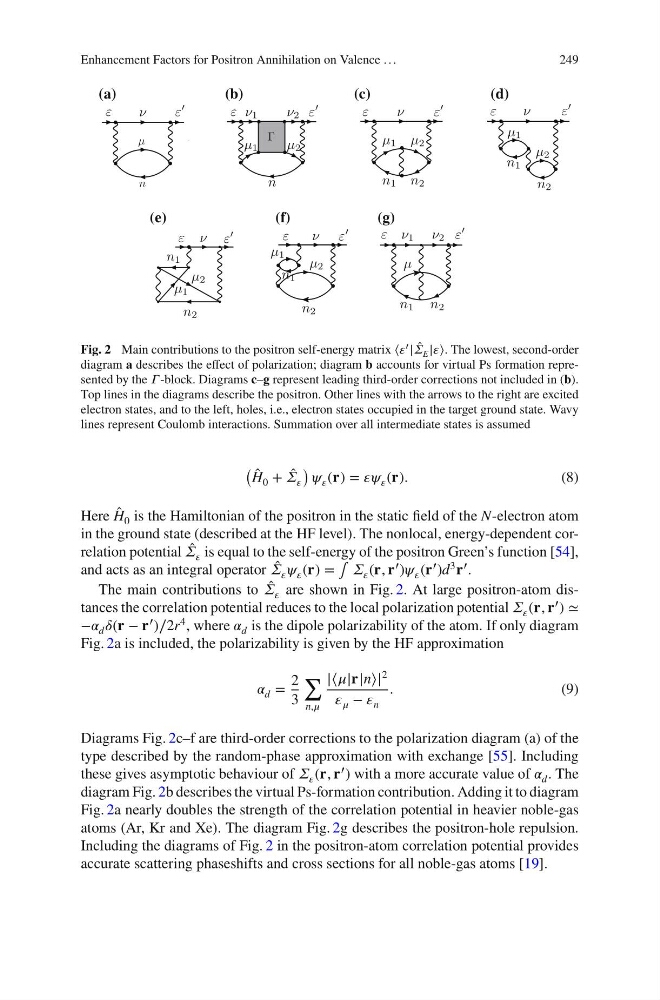
Fig. 2 Main contributions to the positron self-energy matrix ⟨í µí¼ ′ | ̂
í µí»´ E |í µí¼⟩. The lowest, second-order
diagram a describes the effect of polarization; diagram b accounts for virtual Ps formation represented by the í µí»¤ -block. Diagrams c–g represent leading third-order corrections not included in (b).
Top lines in the diagrams describe the positron. Other lines with the arrows to the right are excited
electron states, and to the left, holes, i.e., electron states occupied in the target ground state. Wavy
lines represent Coulomb interactions. Summation over all intermediate states is assumed
( ̂
H 0 + ̂
í µí»´ í µí¼
) í µí¼ í µí¼ (í µí°«) = í µí¼í µí¼ í µí¼ (í µí°«).
(8)
Here ̂
H 0 is the Hamiltonian of the positron in the static field of the N-electron atom
in the ground state (described at the HF level). The nonlocal, energy-dependent correlation potential ̂
í µí»´ í µí¼ is equal to the self-energy of the positron Green’s function [54],
and acts as an integral operator ̂
í µí»´ í µí¼ í µí¼ í µí¼ (í µí°«) = ∫ í µí»´ í µí¼ (í µí°«, í µí°«
′ )í µí¼ í µí¼ (í µí°«
′ )d
3
í µí°«
′ .
The main contributions to ̂
í µí»´ í µí¼ are shown in Fig. 2. At large positron-atom distances the correlation potential reduces to the local polarization potential í µí»´ í µí¼ (í µí°«, í µí°« ′ ) ≃
−í µí»¼ d í µí»¿(í µí°« − í µí°«
′ )∕2r
4 , where í µí»¼ d is the dipole polarizability of the atom. If only diagram
Fig. 2a is included, the polarizability is given by the HF approximation
í µí»¼ d =
2
3
∑
n,í µí¼
|⟨í µí¼|í µí°«|n⟩|
2
í µí¼ í µí¼ − í µí¼ n
.
(9)
Diagrams Fig. 2c–f are third-order corrections to the polarization diagram (a) of the
type described by the random-phase approximation with exchange [55]. Including
these gives asymptotic behaviour of í µí»´ í µí¼ (í µí°«, í µí°« ′ ) with a more accurate value of í µí»¼ d . The
diagram Fig. 2b describes the virtual Ps-formation contribution. Adding it to diagram
Fig. 2a nearly doubles the strength of the correlation potential in heavier noble-gas
atoms (Ar, Kr and Xe). The diagram Fig. 2g describes the positron-hole repulsion.
Including the diagrams of Fig. 2 in the positron-atom correlation potential provides
accurate scattering phaseshifts and cross sections for all noble-gas atoms [19].
249
+
+
+
+
ε
ε
ν
μ 1
μ 2
n 1
ε ν
ε
n 2
n 2
μ 2
μ 1
n 1
ε
ε
μ 1 μ 2
ν
n 1 n 2
ε
ε
Γ
ε
μ 1
μ 2
n
ν 2
ν 1
ε
ν
ε
+
n
μ
ε
n 1
μ 2
μ 1
ν
ε
n 2
ε
ε
n 2
n 1
ν 2
ν 1
ε
μ
(a)
(b)
(c)
(d)
(e)
(f)
(g)
Fig. 2 Main contributions to the positron self-energy matrix ⟨í µí¼ ′ | ̂
í µí»´ E |í µí¼⟩. The lowest, second-order
diagram a describes the effect of polarization; diagram b accounts for virtual Ps formation represented by the í µí»¤ -block. Diagrams c–g represent leading third-order corrections not included in (b).
Top lines in the diagrams describe the positron. Other lines with the arrows to the right are excited
electron states, and to the left, holes, i.e., electron states occupied in the target ground state. Wavy
lines represent Coulomb interactions. Summation over all intermediate states is assumed
( ̂
H 0 + ̂
í µí»´ í µí¼
) í µí¼ í µí¼ (í µí°«) = í µí¼í µí¼ í µí¼ (í µí°«).
(8)
Here ̂
H 0 is the Hamiltonian of the positron in the static field of the N-electron atom
in the ground state (described at the HF level). The nonlocal, energy-dependent correlation potential ̂
í µí»´ í µí¼ is equal to the self-energy of the positron Green’s function [54],
and acts as an integral operator ̂
í µí»´ í µí¼ í µí¼ í µí¼ (í µí°«) = ∫ í µí»´ í µí¼ (í µí°«, í µí°«
′ )í µí¼ í µí¼ (í µí°«
′ )d
3
í µí°«
′ .
The main contributions to ̂
í µí»´ í µí¼ are shown in Fig. 2. At large positron-atom distances the correlation potential reduces to the local polarization potential í µí»´ í µí¼ (í µí°«, í µí°« ′ ) ≃
−í µí»¼ d í µí»¿(í µí°« − í µí°«
′ )∕2r
4 , where í µí»¼ d is the dipole polarizability of the atom. If only diagram
Fig. 2a is included, the polarizability is given by the HF approximation
í µí»¼ d =
2
3
∑
n,í µí¼
|⟨í µí¼|í µí°«|n⟩|
2
í µí¼ í µí¼ − í µí¼ n
.
(9)
Diagrams Fig. 2c–f are third-order corrections to the polarization diagram (a) of the
type described by the random-phase approximation with exchange [55]. Including
these gives asymptotic behaviour of í µí»´ í µí¼ (í µí°«, í µí°« ′ ) with a more accurate value of í µí»¼ d . The
diagram Fig. 2b describes the virtual Ps-formation contribution. Adding it to diagram
Fig. 2a nearly doubles the strength of the correlation potential in heavier noble-gas
atoms (Ar, Kr and Xe). The diagram Fig. 2g describes the positron-hole repulsion.
Including the diagrams of Fig. 2 in the positron-atom correlation potential provides
accurate scattering phaseshifts and cross sections for all noble-gas atoms [19].