

Theor Chem Acc (2015) 134:132
1 3
results of both methods improve with larger QM subsystems. In the case of the smaller QM subsystem, cut1 in
Fig. 6 , the mean absolute error and the largest error are
1.5 and 4.8 kcal/mol, respectively, for the LA method,
while they are 1.5 and 5.3 kcal/mol, respectively, for the
HLSCF method. Note that MM dihedral parameters contribute to the obtained energies for this small QM subsystem. Increasing the size of the QM region decreases both
the mean and the maximum error; 0.2 and 0.3 kcal/mol for
the LA and 1.0 and 1.5 kcal/mol for the HLSCF method
are obtained. In summary, it was found that both methods
are able to reproduce the reference results for the rotation
of the imidazole group within 5 % relative error when the
amide bonds are included in the QM subsystems and thus
the subsystem boundaries are separated from the rotating
bond by 3 bonds.
4.3 Proton transfer energy curve
The fourth example comprises an Ace–His–Nme and a
Ace–Asp–Nme peptide, where the proton transfer between
the Asp and His residues was investigated. In this reaction,
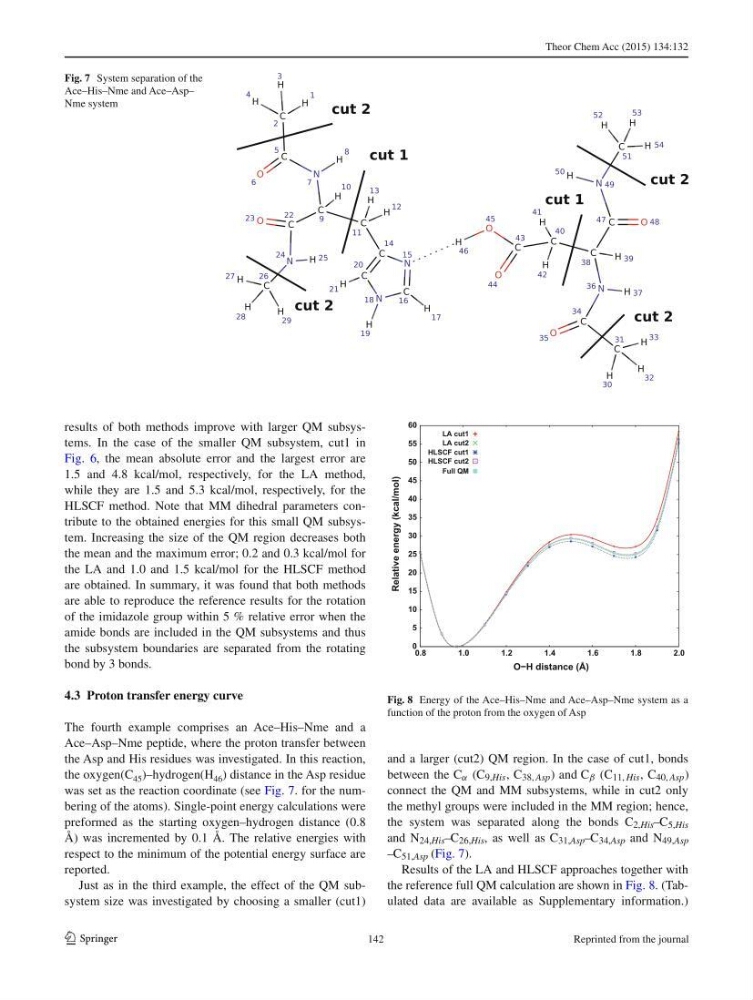
the oxygen(C 45 )–hydrogen(H 46 ) distance in the Asp residue
was set as the reaction coordinate (see Fig. 7 . for the numbering of the atoms). Single-point energy calculations were
preformed as the starting oxygen–hydrogen distance (0.8
Å) was incremented by 0.1 Å. The relative energies with
respect to the minimum of the potential energy surface are
reported.
Just as in the third example, the effect of the QM subsystem size was investigated by choosing a smaller (cut1)
and a larger (cut2) QM region. In the case of cut1, bonds
between the C α (C 9,His , C 38, Asp ) and C β (C 11, His , C 40, Asp )
connect the QM and MM subsystems, while in cut2 only
the methyl groups were included in the MM region; hence,
the system was separated along the bonds C 2,His – C 5,His
and N 24,His – C 26,His , as well as C 31,Asp – C 34,Asp and N 49,Asp
– C 51,Asp (Fig. 7 ).
Results of the LA and HLSCF approaches together with
the reference full QM calculation are shown in Fig. 8 . (Tabulated data are available as Supplementary information.)
Fig. 7 System separation of the
Ace–His–Nme and Ace–Asp–
Nme system
0
5
10
15
20
25
30
35
40
45
50
55
60
0.8
1.0
1.2
1.4
1.6
1.8
2.0
Relative energy (kcal/mol)
O−H distance (Å)
LA cut1
LA cut2
HLSCF cut1
HLSCF cut2
Full QM
Fig. 8 Energy of the Ace–His–Nme and Ace–Asp–Nme system as a
function of the proton from the oxygen of Asp
142
Reprinted from the journal
1 3
results of both methods improve with larger QM subsystems. In the case of the smaller QM subsystem, cut1 in
Fig. 6 , the mean absolute error and the largest error are
1.5 and 4.8 kcal/mol, respectively, for the LA method,
while they are 1.5 and 5.3 kcal/mol, respectively, for the
HLSCF method. Note that MM dihedral parameters contribute to the obtained energies for this small QM subsystem. Increasing the size of the QM region decreases both
the mean and the maximum error; 0.2 and 0.3 kcal/mol for
the LA and 1.0 and 1.5 kcal/mol for the HLSCF method
are obtained. In summary, it was found that both methods
are able to reproduce the reference results for the rotation
of the imidazole group within 5 % relative error when the
amide bonds are included in the QM subsystems and thus
the subsystem boundaries are separated from the rotating
bond by 3 bonds.
4.3 Proton transfer energy curve
The fourth example comprises an Ace–His–Nme and a
Ace–Asp–Nme peptide, where the proton transfer between
the Asp and His residues was investigated. In this reaction,
the oxygen(C 45 )–hydrogen(H 46 ) distance in the Asp residue
was set as the reaction coordinate (see Fig. 7 . for the numbering of the atoms). Single-point energy calculations were
preformed as the starting oxygen–hydrogen distance (0.8
Å) was incremented by 0.1 Å. The relative energies with
respect to the minimum of the potential energy surface are
reported.
Just as in the third example, the effect of the QM subsystem size was investigated by choosing a smaller (cut1)
and a larger (cut2) QM region. In the case of cut1, bonds
between the C α (C 9,His , C 38, Asp ) and C β (C 11, His , C 40, Asp )
connect the QM and MM subsystems, while in cut2 only
the methyl groups were included in the MM region; hence,
the system was separated along the bonds C 2,His – C 5,His
and N 24,His – C 26,His , as well as C 31,Asp – C 34,Asp and N 49,Asp
– C 51,Asp (Fig. 7 ).
Results of the LA and HLSCF approaches together with
the reference full QM calculation are shown in Fig. 8 . (Tabulated data are available as Supplementary information.)
Fig. 7 System separation of the
Ace–His–Nme and Ace–Asp–
Nme system
0
5
10
15
20
25
30
35
40
45
50
55
60
0.8
1.0
1.2
1.4
1.6
1.8
2.0
Relative energy (kcal/mol)
O−H distance (Å)
LA cut1
LA cut2
HLSCF cut1
HLSCF cut2
Full QM
Fig. 8 Energy of the Ace–His–Nme and Ace–Asp–Nme system as a
function of the proton from the oxygen of Asp
142
Reprinted from the journal