

Theor Chem Acc (2015) 134:116
1 3
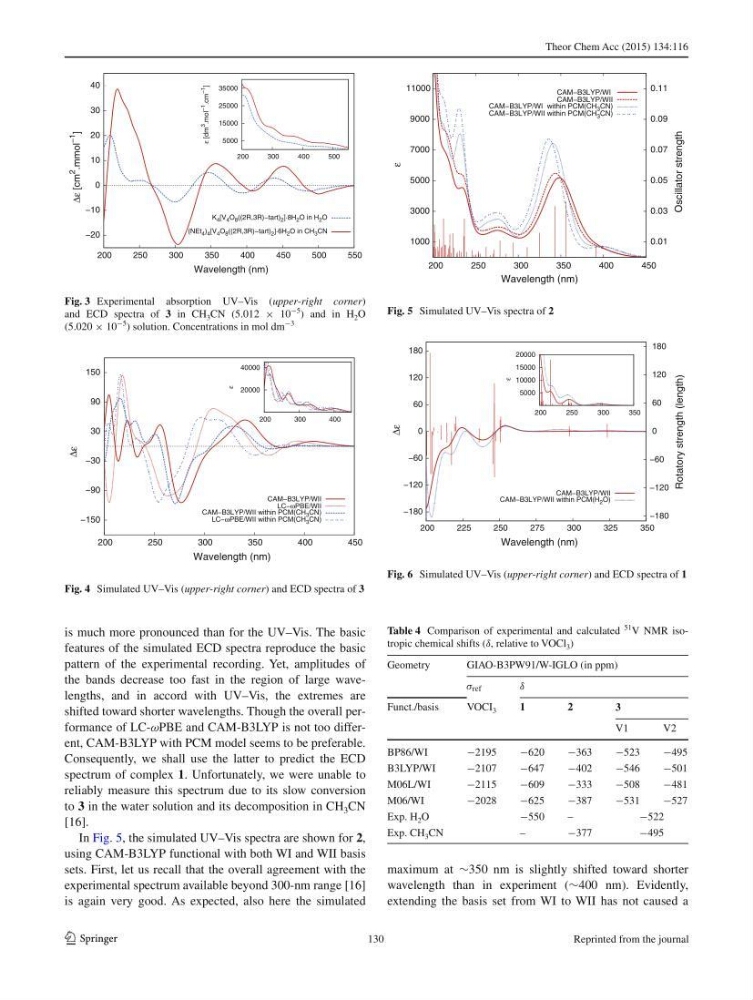
is much more pronounced than for the UV–Vis. The basic
features of the simulated ECD spectra reproduce the basic
pattern of the experimental recording. Yet, amplitudes of
the bands decrease too fast in the region of large wavelengths, and in accord with UV–Vis, the extremes are
shifted toward shorter wavelengths. Though the overall performance of LC- ω PBE and CAM-B3LYP is not too different, CAM-B3LYP with PCM model seems to be preferable.
Consequently, we shall use the latter to predict the ECD
spectrum of complex 1 . Unfortunately, we were unable to
reliably measure this spectrum due to its slow conversion
to 3 in the water solution and its decomposition in CH 3 CN
[ 16 ].
In Fig. 5 , the simulated UV–Vis spectra are shown for 2 ,
using CAM-B3LYP functional with both WI and WII basis
sets. First, let us recall that the overall agreement with the
experimental spectrum available beyond 300-nm range [ 16 ]
is again very good. As expected, also here the simulated
maximum at ∼350 nm is slightly shifted toward shorter
wavelength than in experiment (∼400 nm). Evidently,
extending the basis set from WI to WII has not caused a
−20
−10
0
10
20
30
40
200
250
300
350
400
450
500
550
Δε [cm
2
.mmol
−1
]
Wavelength (nm)
K 4 [V 4 O 8 ((2R,3R)−tart) 2 ]·8H 2 O in H 2 O
(NEt 4 ) 4 [V 4 O 8 ((2R,3R)−tart) 2 ]·6H 2 O in CH 3 CN
5000
15000
25000
35000
200
300
400
500
ε [dm
3
.mol
−1
.cm
−1
]
Fig. 3 Experimental absorption UV–Vis ( upper - right corner )
and ECD spectra of 3 in CH 3 CN (5.012 × 10
−5
) and in H 2 O
(5.020 × 10
−5 ) solution. Concentrations in mol dm
−3
−150
−90
−30
30
90
150
200
250
300
350
400
450
Δε
Wavelength (nm)
CAM−B3LYP/WII
LC−ωPBE/WII
CAM−B3LYP/WII within PCM(CH 3 CN)
LC−ωPBE/WII within PCM(CH 3 CN)
20000
40000
200
300
400
ε
Fig. 4 Simulated UV–Vis ( upper - right corner ) and ECD spectra of 3
1000
3000
5000
7000
9000
11000
200
250
300
350
400
450
0.01
0.03
0.05
0.07
0.09
0.11
ε
Oscillator strength
Wavelength (nm)
CAM−B3LYP/WI
CAM−B3LYP/WII
CAM−B3LYP/WI within PCM(CH 3 CN)
CAM−B3LYP/WII within PCM(CH 3 CN)
Fig. 5 Simulated UV–Vis spectra of 2
−180
−120
−60
0
60
120
180
200
225
250
275
300
325
350
−180
−120
−60
0
60
120
180
Δε
Rotatory strength (length)
Wavelength (nm)
CAM−B3LYP/WII
CAM−B3LYP/WII within PCM(H 2 O)
5000
10000
15000
20000
200
250
300
350
ε
Fig. 6 Simulated UV–Vis ( upper - right corner ) and ECD spectra of 1
Table 4 Comparison of experimental and calculated
51 V NMR isotropic chemical shifts ( δ , relative to VOCl 3 )
Geometry
GIAO-B3PW91/W-IGLO (in ppm)
σ ref
δ
Funct./basis
VOCI 3
1
2
3
V1
V2
BP86/WI
−2195
−620
−363
−523
−495
B3LYP/WI
−2107
−647
−402
−546
−501
M06L/WI
−2115
−609
−333
−508
−481
M06/WI
−2028
−625
−387
−531
−527
Exp. H 2 O
−550
–
−522
Exp. CH 3 CN
–
−377
−495
130
Reprinted from the journal
1 3
is much more pronounced than for the UV–Vis. The basic
features of the simulated ECD spectra reproduce the basic
pattern of the experimental recording. Yet, amplitudes of
the bands decrease too fast in the region of large wavelengths, and in accord with UV–Vis, the extremes are
shifted toward shorter wavelengths. Though the overall performance of LC- ω PBE and CAM-B3LYP is not too different, CAM-B3LYP with PCM model seems to be preferable.
Consequently, we shall use the latter to predict the ECD
spectrum of complex 1 . Unfortunately, we were unable to
reliably measure this spectrum due to its slow conversion
to 3 in the water solution and its decomposition in CH 3 CN
[ 16 ].
In Fig. 5 , the simulated UV–Vis spectra are shown for 2 ,
using CAM-B3LYP functional with both WI and WII basis
sets. First, let us recall that the overall agreement with the
experimental spectrum available beyond 300-nm range [ 16 ]
is again very good. As expected, also here the simulated
maximum at ∼350 nm is slightly shifted toward shorter
wavelength than in experiment (∼400 nm). Evidently,
extending the basis set from WI to WII has not caused a
−20
−10
0
10
20
30
40
200
250
300
350
400
450
500
550
Δε [cm
2
.mmol
−1
]
Wavelength (nm)
K 4 [V 4 O 8 ((2R,3R)−tart) 2 ]·8H 2 O in H 2 O
(NEt 4 ) 4 [V 4 O 8 ((2R,3R)−tart) 2 ]·6H 2 O in CH 3 CN
5000
15000
25000
35000
200
300
400
500
ε [dm
3
.mol
−1
.cm
−1
]
Fig. 3 Experimental absorption UV–Vis ( upper - right corner )
and ECD spectra of 3 in CH 3 CN (5.012 × 10
−5
) and in H 2 O
(5.020 × 10
−5 ) solution. Concentrations in mol dm
−3
−150
−90
−30
30
90
150
200
250
300
350
400
450
Δε
Wavelength (nm)
CAM−B3LYP/WII
LC−ωPBE/WII
CAM−B3LYP/WII within PCM(CH 3 CN)
LC−ωPBE/WII within PCM(CH 3 CN)
20000
40000
200
300
400
ε
Fig. 4 Simulated UV–Vis ( upper - right corner ) and ECD spectra of 3
1000
3000
5000
7000
9000
11000
200
250
300
350
400
450
0.01
0.03
0.05
0.07
0.09
0.11
ε
Oscillator strength
Wavelength (nm)
CAM−B3LYP/WI
CAM−B3LYP/WII
CAM−B3LYP/WI within PCM(CH 3 CN)
CAM−B3LYP/WII within PCM(CH 3 CN)
Fig. 5 Simulated UV–Vis spectra of 2
−180
−120
−60
0
60
120
180
200
225
250
275
300
325
350
−180
−120
−60
0
60
120
180
Δε
Rotatory strength (length)
Wavelength (nm)
CAM−B3LYP/WII
CAM−B3LYP/WII within PCM(H 2 O)
5000
10000
15000
20000
200
250
300
350
ε
Fig. 6 Simulated UV–Vis ( upper - right corner ) and ECD spectra of 1
Table 4 Comparison of experimental and calculated
51 V NMR isotropic chemical shifts ( δ , relative to VOCl 3 )
Geometry
GIAO-B3PW91/W-IGLO (in ppm)
σ ref
δ
Funct./basis
VOCI 3
1
2
3
V1
V2
BP86/WI
−2195
−620
−363
−523
−495
B3LYP/WI
−2107
−647
−402
−546
−501
M06L/WI
−2115
−609
−333
−508
−481
M06/WI
−2028
−625
−387
−531
−527
Exp. H 2 O
−550
–
−522
Exp. CH 3 CN
–
−377
−495
130
Reprinted from the journal