

Theor Chem Acc (2015) 134:116
1 3
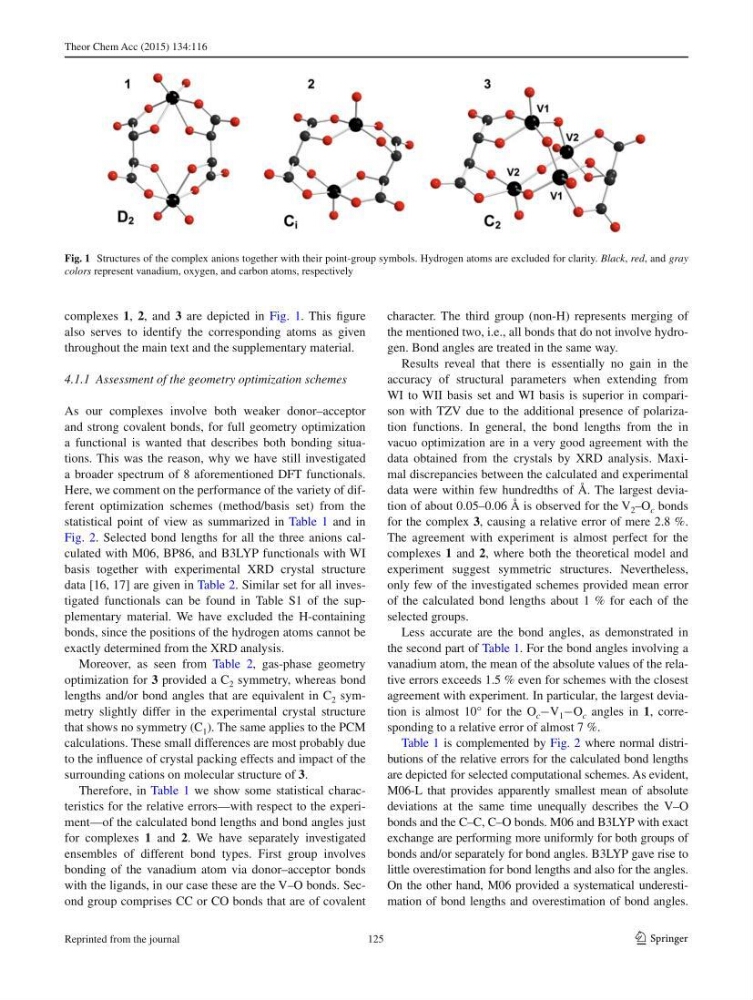
complexes 1 , 2 , and 3 are depicted in Fig. 1 . This fi gure
also serves to identify the corresponding atoms as given
throughout the main text and the supplementary material.
4.1.1 Assessment of the geometry optimization schemes
As our complexes involve both weaker donor–acceptor
and strong covalent bonds, for full geometry optimization
a functional is wanted that describes both bonding situations. This was the reason, why we have still investigated
a broader spectrum of 8 aforementioned DFT functionals.
Here, we comment on the performance of the variety of different optimization schemes (method/basis set) from the
statistical point of view as summarized in Table 1 and in
Fig. 2 . Selected bond lengths for all the three anions calculated with M06, BP86, and B3LYP functionals with WI
basis together with experimental XRD crystal structure
data [ 16 , 17 ] are given in Table 2 . Similar set for all investigated functionals can be found in Table S1 of the supplementary material. We have excluded the H-containing
bonds, since the positions of the hydrogen atoms cannot be
exactly determined from the XRD analysis.
Moreover, as seen from Table 2 , gas-phase geometry
optimization for 3 provided a C 2 symmetry, whereas bond
lengths and/or bond angles that are equivalent in C 2 symmetry slightly differ in the experimental crystal structure
that shows no symmetry (C 1 ). The same applies to the PCM
calculations. These small differences are most probably due
to the infl uence of crystal packing effects and impact of the
surrounding cations on molecular structure of 3 .
Therefore, in Table 1 we show some statistical characteristics for the relative errors—with respect to the experiment—of the calculated bond lengths and bond angles just
for complexes 1 and 2 . We have separately investigated
ensembles of different bond types. First group involves
bonding of the vanadium atom via donor–acceptor bonds
with the ligands, in our case these are the V–O bonds. Second group comprises CC or CO bonds that are of covalent
character. The third group (non-H) represents merging of
the mentioned two, i.e., all bonds that do not involve hydrogen. Bond angles are treated in the same way.
Results reveal that there is essentially no gain in the
accuracy of structural parameters when extending from
WI to WII basis set and WI basis is superior in comparison with TZV due to the additional presence of polarization functions. In general, the bond lengths from the in
vacuo optimization are in a very good agreement with the
data obtained from the crystals by XRD analysis. Maximal discrepancies between the calculated and experimental
data were within few hundredths of Å. The largest deviation of about 0.05–0.06 Å is observed for the V 2 –O c bonds
for the complex 3 , causing a relative error of mere 2.8 %.
The agreement with experiment is almost perfect for the
complexes 1 and 2 , where both the theoretical model and
experiment suggest symmetric structures. Nevertheless,
only few of the investigated schemes provided mean error
of the calculated bond lengths about 1 % for each of the
selected groups.
Less accurate are the bond angles, as demonstrated in
the second part of Table 1 . For the bond angles involving a
vanadium atom, the mean of the absolute values of the relative errors exceeds 1.5 % even for schemes with the closest
agreement with experiment. In particular, the largest deviation is almost 10° for the O c −V 1 −O c angles in 1 , corresponding to a relative error of almost 7 %.
Table 1 is complemented by Fig. 2 where normal distributions of the relative errors for the calculated bond lengths
are depicted for selected computational schemes. As evident,
M06-L that provides apparently smallest mean of absolute
deviations at the same time unequally describes the V–O
bonds and the C–C, C–O bonds. M06 and B3LYP with exact
exchange are performing more uniformly for both groups of
bonds and/or separately for bond angles. B3LYP gave rise to
little overestimation for bond lengths and also for the angles.
On the other hand, M06 provided a systematical underestimation of bond lengths and overestimation of bond angles.
Fig. 1 Structures of the complex anions together with their point-group symbols. Hydrogen atoms are excluded for clarity. Black , red , and gray
colors represent vanadium, oxygen, and carbon atoms, respectively
125
Reprinted from the journal
1 3
complexes 1 , 2 , and 3 are depicted in Fig. 1 . This fi gure
also serves to identify the corresponding atoms as given
throughout the main text and the supplementary material.
4.1.1 Assessment of the geometry optimization schemes
As our complexes involve both weaker donor–acceptor
and strong covalent bonds, for full geometry optimization
a functional is wanted that describes both bonding situations. This was the reason, why we have still investigated
a broader spectrum of 8 aforementioned DFT functionals.
Here, we comment on the performance of the variety of different optimization schemes (method/basis set) from the
statistical point of view as summarized in Table 1 and in
Fig. 2 . Selected bond lengths for all the three anions calculated with M06, BP86, and B3LYP functionals with WI
basis together with experimental XRD crystal structure
data [ 16 , 17 ] are given in Table 2 . Similar set for all investigated functionals can be found in Table S1 of the supplementary material. We have excluded the H-containing
bonds, since the positions of the hydrogen atoms cannot be
exactly determined from the XRD analysis.
Moreover, as seen from Table 2 , gas-phase geometry
optimization for 3 provided a C 2 symmetry, whereas bond
lengths and/or bond angles that are equivalent in C 2 symmetry slightly differ in the experimental crystal structure
that shows no symmetry (C 1 ). The same applies to the PCM
calculations. These small differences are most probably due
to the infl uence of crystal packing effects and impact of the
surrounding cations on molecular structure of 3 .
Therefore, in Table 1 we show some statistical characteristics for the relative errors—with respect to the experiment—of the calculated bond lengths and bond angles just
for complexes 1 and 2 . We have separately investigated
ensembles of different bond types. First group involves
bonding of the vanadium atom via donor–acceptor bonds
with the ligands, in our case these are the V–O bonds. Second group comprises CC or CO bonds that are of covalent
character. The third group (non-H) represents merging of
the mentioned two, i.e., all bonds that do not involve hydrogen. Bond angles are treated in the same way.
Results reveal that there is essentially no gain in the
accuracy of structural parameters when extending from
WI to WII basis set and WI basis is superior in comparison with TZV due to the additional presence of polarization functions. In general, the bond lengths from the in
vacuo optimization are in a very good agreement with the
data obtained from the crystals by XRD analysis. Maximal discrepancies between the calculated and experimental
data were within few hundredths of Å. The largest deviation of about 0.05–0.06 Å is observed for the V 2 –O c bonds
for the complex 3 , causing a relative error of mere 2.8 %.
The agreement with experiment is almost perfect for the
complexes 1 and 2 , where both the theoretical model and
experiment suggest symmetric structures. Nevertheless,
only few of the investigated schemes provided mean error
of the calculated bond lengths about 1 % for each of the
selected groups.
Less accurate are the bond angles, as demonstrated in
the second part of Table 1 . For the bond angles involving a
vanadium atom, the mean of the absolute values of the relative errors exceeds 1.5 % even for schemes with the closest
agreement with experiment. In particular, the largest deviation is almost 10° for the O c −V 1 −O c angles in 1 , corresponding to a relative error of almost 7 %.
Table 1 is complemented by Fig. 2 where normal distributions of the relative errors for the calculated bond lengths
are depicted for selected computational schemes. As evident,
M06-L that provides apparently smallest mean of absolute
deviations at the same time unequally describes the V–O
bonds and the C–C, C–O bonds. M06 and B3LYP with exact
exchange are performing more uniformly for both groups of
bonds and/or separately for bond angles. B3LYP gave rise to
little overestimation for bond lengths and also for the angles.
On the other hand, M06 provided a systematical underestimation of bond lengths and overestimation of bond angles.
Fig. 1 Structures of the complex anions together with their point-group symbols. Hydrogen atoms are excluded for clarity. Black , red , and gray
colors represent vanadium, oxygen, and carbon atoms, respectively
125
Reprinted from the journal