

Similar SOC effects have been put in evidence on the electronic spectroscopy of
[Re(imidazole)(CO) 3 (phen)]
+ [76] for which correlation diagrams between “spinfree” and “spin-orbit” states become very complicated as illustrated in Fig. 5.
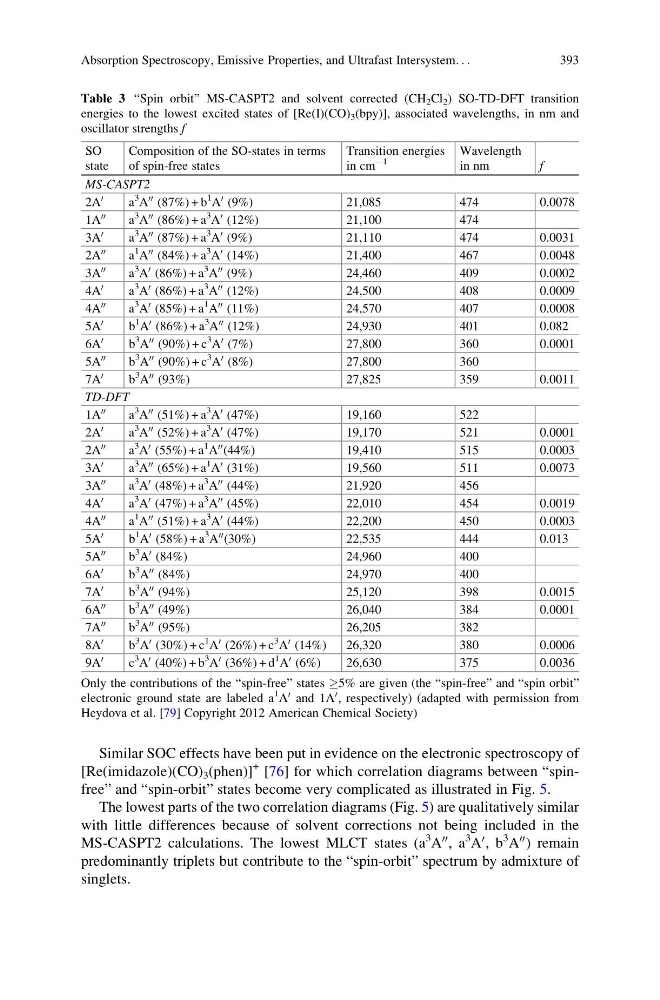
The lowest parts of the two correlation diagrams (Fig. 5) are qualitatively similar
with little differences because of solvent corrections not being included in the
MS-CASPT2 calculations. The lowest MLCT states (a
3 A
00 , a
3 A
0 , b
3 A
00 ) remain
predominantly triplets but contribute to the “spin-orbit” spectrum by admixture of
singlets.
Table 3 “Spin orbit” MS-CASPT2 and solvent corrected (CH 2 Cl 2 ) SO-TD-DFT transition
energies to the lowest excited states of [Re(I)(CO) 3 (bpy)], associated wavelengths, in nm and
oscillator strengths f
SO
state
Composition of the SO-states in terms
of spin-free states
Transition energies
in cm
À1
Wavelength
in nm
f
MS-CASPT2
2A
0
a
3
A
00 (87%) + b
1
A
0 (9%)
21,085
474
0.0078
1A
00
a
3
A
00 (86%) + a
3
A
0 (12%)
21,100
474
3A
0
a
3
A
00 (87%) + a
3
A
0 (9%)
21,110
474
0.0031
2A
00
a
1
A
00 (84%) + a
3
A
0 (14%)
21,400
467
0.0048
3A
00
a
3
A
0 (86%) + a
3
A
00 (9%)
24,460
409
0.0002
4A
0
a
3
A
0 (86%) + a
3
A
00 (12%)
24,500
408
0.0009
4A
00
a
3
A
0 (85%) + a
1
A
00 (11%)
24,570
407
0.0008
5A
0
b
1
A
0 (86%) + a
3
A
00 (12%)
24,930
401
0.082
6A
0
b
3
A
00 (90%) + c
3
A
0 (7%)
27,800
360
0.0001
5A
00
b
3
A
00 (90%) + c
3
A
0 (8%)
27,800
360
7A
0
b
3
A
00 (93%)
27,825
359
0.0011
TD-DFT
1A
00
a
3
A
00 (51%) + a
3
A
0 (47%)
19,160
522
2A
0
a
3
A
00 (52%) + a
3
A
0 (47%)
19,170
521
0.0001
2A
00
a
3
A
0 (55%) + a
1
A
00 (44%)
19,410
515
0.0003
3A
0
a
3
A
00 (65%) + a
1
A
0 (31%)
19,560
511
0.0073
3A
00
a
3
A
0 (48%) + a
3
A
00 (44%)
21,920
456
4A
0
a
3
A
0 (47%) + a
3
A
00 (45%)
22,010
454
0.0019
4A
00
a
1
A
00 (51%) + a
3
A
0 (44%)
22,200
450
0.0003
5A
0
b
1
A
0 (58%) + a
3
A
00 (30%)
22,535
444
0.013
5A
00
b
3
A
0 (84%)
24,960
400
6A
0
b
3
A
00 (84%)
24,970
400
7A
0
b
3
A
00 (94%)
25,120
398
0.0015
6A
00
b
3
A
00 (49%)
26,040
384
0.0001
7A
00
b
3
A
00 (95%)
26,205
382
8A
0
b
3
A
0 (30%) + c
1
A
0 (26%) + c
3
A
0 (14%)
26,320
380
0.0006
9A
0
c
3
A
0 (40%) + b
3
A
0 (36%) + d
1
A
0 (6%)
26,630
375
0.0036
Only the contributions of the “spin-free” states !5% are given (the “spin-free” and “spin orbit”
electronic ground state are labeled a
1
A
0 and 1A
0 , respectively) (adapted with permission from
Heydova et al. [79] Copyright 2012 American Chemical Society)
Absorption Spectroscopy, Emissive Properties, and Ultrafast Intersystem. . .
393
[Re(imidazole)(CO) 3 (phen)]
+ [76] for which correlation diagrams between “spinfree” and “spin-orbit” states become very complicated as illustrated in Fig. 5.
The lowest parts of the two correlation diagrams (Fig. 5) are qualitatively similar
with little differences because of solvent corrections not being included in the
MS-CASPT2 calculations. The lowest MLCT states (a
3 A
00 , a
3 A
0 , b
3 A
00 ) remain
predominantly triplets but contribute to the “spin-orbit” spectrum by admixture of
singlets.
Table 3 “Spin orbit” MS-CASPT2 and solvent corrected (CH 2 Cl 2 ) SO-TD-DFT transition
energies to the lowest excited states of [Re(I)(CO) 3 (bpy)], associated wavelengths, in nm and
oscillator strengths f
SO
state
Composition of the SO-states in terms
of spin-free states
Transition energies
in cm
À1
Wavelength
in nm
f
MS-CASPT2
2A
0
a
3
A
00 (87%) + b
1
A
0 (9%)
21,085
474
0.0078
1A
00
a
3
A
00 (86%) + a
3
A
0 (12%)
21,100
474
3A
0
a
3
A
00 (87%) + a
3
A
0 (9%)
21,110
474
0.0031
2A
00
a
1
A
00 (84%) + a
3
A
0 (14%)
21,400
467
0.0048
3A
00
a
3
A
0 (86%) + a
3
A
00 (9%)
24,460
409
0.0002
4A
0
a
3
A
0 (86%) + a
3
A
00 (12%)
24,500
408
0.0009
4A
00
a
3
A
0 (85%) + a
1
A
00 (11%)
24,570
407
0.0008
5A
0
b
1
A
0 (86%) + a
3
A
00 (12%)
24,930
401
0.082
6A
0
b
3
A
00 (90%) + c
3
A
0 (7%)
27,800
360
0.0001
5A
00
b
3
A
00 (90%) + c
3
A
0 (8%)
27,800
360
7A
0
b
3
A
00 (93%)
27,825
359
0.0011
TD-DFT
1A
00
a
3
A
00 (51%) + a
3
A
0 (47%)
19,160
522
2A
0
a
3
A
00 (52%) + a
3
A
0 (47%)
19,170
521
0.0001
2A
00
a
3
A
0 (55%) + a
1
A
00 (44%)
19,410
515
0.0003
3A
0
a
3
A
00 (65%) + a
1
A
0 (31%)
19,560
511
0.0073
3A
00
a
3
A
0 (48%) + a
3
A
00 (44%)
21,920
456
4A
0
a
3
A
0 (47%) + a
3
A
00 (45%)
22,010
454
0.0019
4A
00
a
1
A
00 (51%) + a
3
A
0 (44%)
22,200
450
0.0003
5A
0
b
1
A
0 (58%) + a
3
A
00 (30%)
22,535
444
0.013
5A
00
b
3
A
0 (84%)
24,960
400
6A
0
b
3
A
00 (84%)
24,970
400
7A
0
b
3
A
00 (94%)
25,120
398
0.0015
6A
00
b
3
A
00 (49%)
26,040
384
0.0001
7A
00
b
3
A
00 (95%)
26,205
382
8A
0
b
3
A
0 (30%) + c
1
A
0 (26%) + c
3
A
0 (14%)
26,320
380
0.0006
9A
0
c
3
A
0 (40%) + b
3
A
0 (36%) + d
1
A
0 (6%)
26,630
375
0.0036
Only the contributions of the “spin-free” states !5% are given (the “spin-free” and “spin orbit”
electronic ground state are labeled a
1
A
0 and 1A
0 , respectively) (adapted with permission from
Heydova et al. [79] Copyright 2012 American Chemical Society)
Absorption Spectroscopy, Emissive Properties, and Ultrafast Intersystem. . .
393