

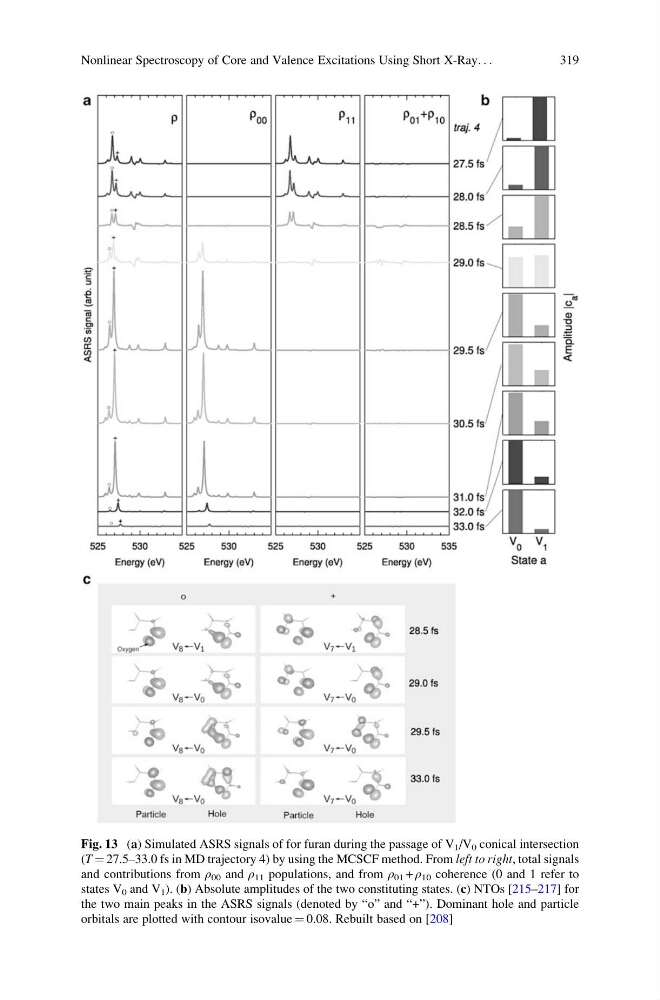
Fig. 13 (a) Simulated ASRS signals of for furan during the passage of V 1 /V 0 conical intersection
(T ¼ 27.5–33.0 fs in MD trajectory 4) by using the MCSCF method. From left to right, total signals
and contributions from ρ 00 and ρ 11 populations, and from ρ 01 + ρ 10 coherence (0 and 1 refer to
states V 0 and V 1 ). (b) Absolute amplitudes of the two constituting states. (c) NTOs [215–217] for
the two main peaks in the ASRS signals (denoted by “o” and “+”). Dominant hole and particle
orbitals are plotted with contour isovalue ¼ 0.08. Rebuilt based on [208]
Nonlinear Spectroscopy of Core and Valence Excitations Using Short X-Ray. . .
319
(T ¼ 27.5–33.0 fs in MD trajectory 4) by using the MCSCF method. From left to right, total signals
and contributions from ρ 00 and ρ 11 populations, and from ρ 01 + ρ 10 coherence (0 and 1 refer to
states V 0 and V 1 ). (b) Absolute amplitudes of the two constituting states. (c) NTOs [215–217] for
the two main peaks in the ASRS signals (denoted by “o” and “+”). Dominant hole and particle
orbitals are plotted with contour isovalue ¼ 0.08. Rebuilt based on [208]
Nonlinear Spectroscopy of Core and Valence Excitations Using Short X-Ray. . .
319