

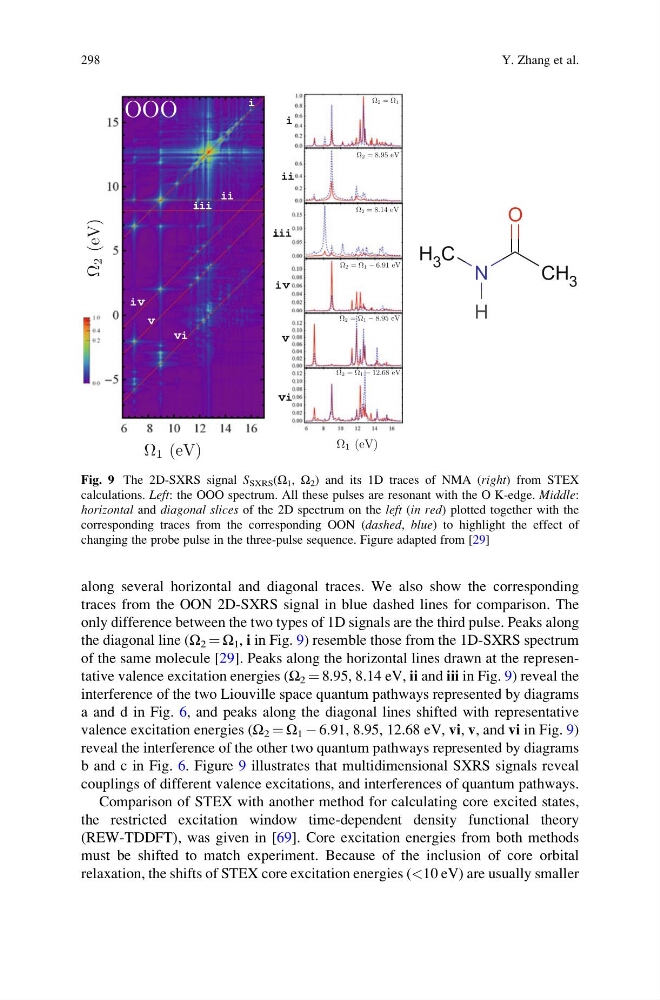
along several horizontal and diagonal traces. We also show the corresponding
traces from the OON 2D-SXRS signal in blue dashed lines for comparison. The
only difference between the two types of 1D signals are the third pulse. Peaks along
the diagonal line (Ω 2 ¼ Ω 1 , i in Fig. 9) resemble those from the 1D-SXRS spectrum
of the same molecule [29]. Peaks along the horizontal lines drawn at the representative valence excitation energies (Ω 2 ¼ 8.95, 8.14 eV, ii and iii in Fig. 9) reveal the
interference of the two Liouville space quantum pathways represented by diagrams
a and d in Fig. 6, and peaks along the diagonal lines shifted with representative
valence excitation energies (Ω 2 ¼ Ω 1 À 6.91, 8.95, 12.68 eV, vi, v, and vi in Fig. 9)
reveal the interference of the other two quantum pathways represented by diagrams
b and c in Fig. 6. Figure 9 illustrates that multidimensional SXRS signals reveal
couplings of different valence excitations, and interferences of quantum pathways.
Comparison of STEX with another method for calculating core excited states,
the restricted excitation window time-dependent density functional theory
(REW-TDDFT), was given in [69]. Core excitation energies from both methods
must be shifted to match experiment. Because of the inclusion of core orbital
relaxation, the shifts of STEX core excitation energies (<10 eV) are usually smaller
Fig. 9 The 2D-SXRS signal S SXRS (Ω 1 , Ω 2 ) and its 1D traces of NMA (right) from STEX
calculations. Left: the OOO spectrum. All these pulses are resonant with the O K-edge. Middle:
horizontal and diagonal slices of the 2D spectrum on the left (in red) plotted together with the
corresponding traces from the corresponding OON (dashed, blue) to highlight the effect of
changing the probe pulse in the three-pulse sequence. Figure adapted from [29]
298
Y. Zhang et al.
traces from the OON 2D-SXRS signal in blue dashed lines for comparison. The
only difference between the two types of 1D signals are the third pulse. Peaks along
the diagonal line (Ω 2 ¼ Ω 1 , i in Fig. 9) resemble those from the 1D-SXRS spectrum
of the same molecule [29]. Peaks along the horizontal lines drawn at the representative valence excitation energies (Ω 2 ¼ 8.95, 8.14 eV, ii and iii in Fig. 9) reveal the
interference of the two Liouville space quantum pathways represented by diagrams
a and d in Fig. 6, and peaks along the diagonal lines shifted with representative
valence excitation energies (Ω 2 ¼ Ω 1 À 6.91, 8.95, 12.68 eV, vi, v, and vi in Fig. 9)
reveal the interference of the other two quantum pathways represented by diagrams
b and c in Fig. 6. Figure 9 illustrates that multidimensional SXRS signals reveal
couplings of different valence excitations, and interferences of quantum pathways.
Comparison of STEX with another method for calculating core excited states,
the restricted excitation window time-dependent density functional theory
(REW-TDDFT), was given in [69]. Core excitation energies from both methods
must be shifted to match experiment. Because of the inclusion of core orbital
relaxation, the shifts of STEX core excitation energies (<10 eV) are usually smaller
Fig. 9 The 2D-SXRS signal S SXRS (Ω 1 , Ω 2 ) and its 1D traces of NMA (right) from STEX
calculations. Left: the OOO spectrum. All these pulses are resonant with the O K-edge. Middle:
horizontal and diagonal slices of the 2D spectrum on the left (in red) plotted together with the
corresponding traces from the corresponding OON (dashed, blue) to highlight the effect of
changing the probe pulse in the three-pulse sequence. Figure adapted from [29]
298
Y. Zhang et al.