

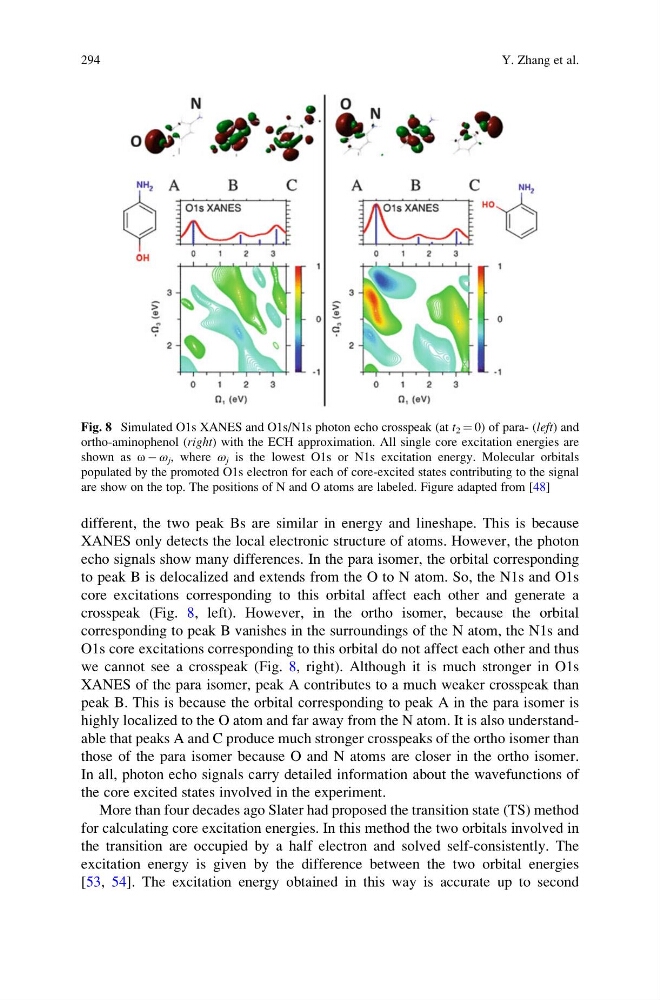
different, the two peak Bs are similar in energy and lineshape. This is because
XANES only detects the local electronic structure of atoms. However, the photon
echo signals show many differences. In the para isomer, the orbital corresponding
to peak B is delocalized and extends from the O to N atom. So, the N1s and O1s
core excitations corresponding to this orbital affect each other and generate a
crosspeak (Fig. 8, left). However, in the ortho isomer, because the orbital
corresponding to peak B vanishes in the surroundings of the N atom, the N1s and
O1s core excitations corresponding to this orbital do not affect each other and thus
we cannot see a crosspeak (Fig. 8, right). Although it is much stronger in O1s
XANES of the para isomer, peak A contributes to a much weaker crosspeak than
peak B. This is because the orbital corresponding to peak A in the para isomer is
highly localized to the O atom and far away from the N atom. It is also understandable that peaks A and C produce much stronger crosspeaks of the ortho isomer than
those of the para isomer because O and N atoms are closer in the ortho isomer.
In all, photon echo signals carry detailed information about the wavefunctions of
the core excited states involved in the experiment.
More than four decades ago Slater had proposed the transition state (TS) method
for calculating core excitation energies. In this method the two orbitals involved in
the transition are occupied by a half electron and solved self-consistently. The
excitation energy is given by the difference between the two orbital energies
[53, 54]. The excitation energy obtained in this way is accurate up to second
Fig. 8 Simulated O1s XANES and O1s/N1s photon echo crosspeak (at t 2 ¼ 0) of para- (left) and
ortho-aminophenol (right) with the ECH approximation. All single core excitation energies are
shown as ω À ω j , where ω j is the lowest O1s or N1s excitation energy. Molecular orbitals
populated by the promoted O1s electron for each of core-excited states contributing to the signal
are show on the top. The positions of N and O atoms are labeled. Figure adapted from [48]
294
Y. Zhang et al.
XANES only detects the local electronic structure of atoms. However, the photon
echo signals show many differences. In the para isomer, the orbital corresponding
to peak B is delocalized and extends from the O to N atom. So, the N1s and O1s
core excitations corresponding to this orbital affect each other and generate a
crosspeak (Fig. 8, left). However, in the ortho isomer, because the orbital
corresponding to peak B vanishes in the surroundings of the N atom, the N1s and
O1s core excitations corresponding to this orbital do not affect each other and thus
we cannot see a crosspeak (Fig. 8, right). Although it is much stronger in O1s
XANES of the para isomer, peak A contributes to a much weaker crosspeak than
peak B. This is because the orbital corresponding to peak A in the para isomer is
highly localized to the O atom and far away from the N atom. It is also understandable that peaks A and C produce much stronger crosspeaks of the ortho isomer than
those of the para isomer because O and N atoms are closer in the ortho isomer.
In all, photon echo signals carry detailed information about the wavefunctions of
the core excited states involved in the experiment.
More than four decades ago Slater had proposed the transition state (TS) method
for calculating core excitation energies. In this method the two orbitals involved in
the transition are occupied by a half electron and solved self-consistently. The
excitation energy is given by the difference between the two orbital energies
[53, 54]. The excitation energy obtained in this way is accurate up to second
Fig. 8 Simulated O1s XANES and O1s/N1s photon echo crosspeak (at t 2 ¼ 0) of para- (left) and
ortho-aminophenol (right) with the ECH approximation. All single core excitation energies are
shown as ω À ω j , where ω j is the lowest O1s or N1s excitation energy. Molecular orbitals
populated by the promoted O1s electron for each of core-excited states contributing to the signal
are show on the top. The positions of N and O atoms are labeled. Figure adapted from [48]
294
Y. Zhang et al.