

r ^
M ^
U Δt
ð Þ
Ψ A t
ð Þ
¼ M r
ð Þ r ^
U Δt
ð Þ
Ψ A t
ð Þ
r ^
M ^
U v Δt
ð Þ
Ψ B t
ð Þ
¼ 0
k 1 À ^
M
Â
à ^
U Δt
ð Þ
Ψ A t
ð Þ
¼
ð
k
r
1 À M r
ð Þ
½
r ^
U Δt
ð Þ
Ψ A t
ð Þ
dr
k 1 À ^
M
Â
à ^
U v Δt
ð Þ
Ψ B t
ð Þ
¼ k ^
U v Δt
ð Þ
Ψ B t
ð Þ
8
> > > > <
> > > > :
: ð97Þ
Together with (91), it defines a modified scheme completely equivalent to the
previous one in the limit where r s is big enough to justify the outgoing flow
condition. The distance at which this condition is satisfied ultimately depends on
the electron dynamics induced by the external fields.
In (97) the first two equations, which govern the evolution of the real-space
components of the wavefunction in A, are no longer connected with the momentumspace ones, and the propagation is thus equivalent to a time propagation with a
mask function absorber similar to that in (66). The new more stable scheme thus
comes at the price of introducing spurious reflections. Such reflections can, in
principle, be reduced by using the most appropriate MFA or a CAP connected via
equation (67). In the energy range where the MFA is absorbing, it is possible to
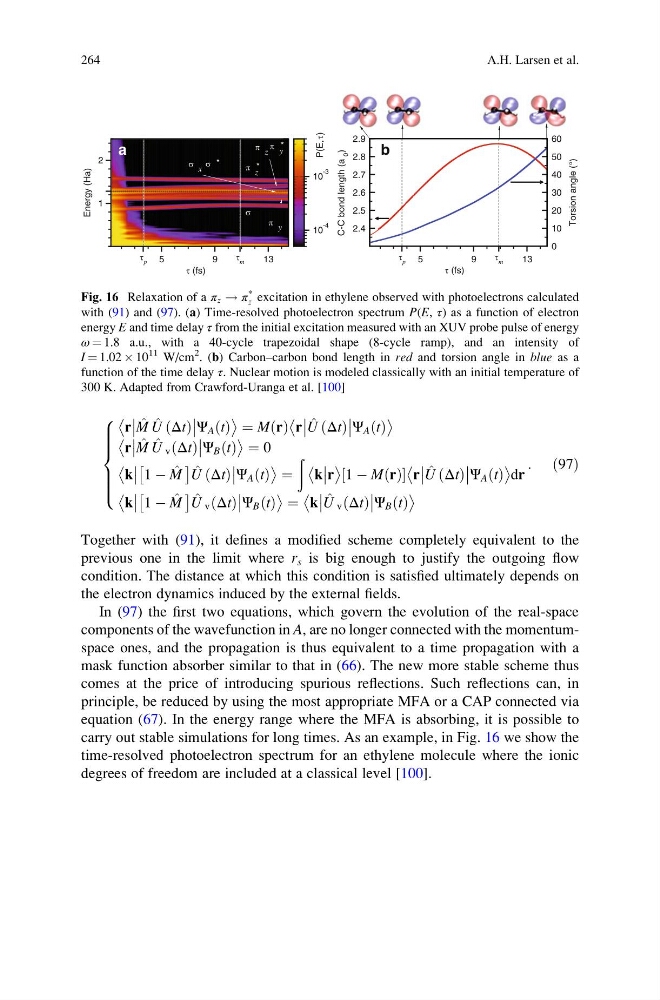
carry out stable simulations for long times. As an example, in Fig. 16 we show the
time-resolved photoelectron spectrum for an ethylene molecule where the ionic
degrees of freedom are included at a classical level [100].
5
9
1 3
τ p
τ m
τ (fs)
1
2
Energy (Ha)
2.4
2.5
2.6
2.7
2.8
2.9
C-C bond length (a
0
)
10
-4
10
-3
P(E,τ)
0
10
20
30
40
50
60
Torsion angle (°)
σ x
*
σ
π z
*
π z
π y
*
π y
σ
5
9
1 3
τ p
τ m
τ (fs)
a
b
Fig. 16 Relaxation of a π z ! π
*
z excitation in ethylene observed with photoelectrons calculated
with (91) and (97). (a) Time-resolved photoelectron spectrum P(E, τ) as a function of electron
energy E and time delay τ from the initial excitation measured with an XUV probe pulse of energy
ω ¼ 1.8 a.u., with a 40-cycle trapezoidal shape (8-cycle ramp), and an intensity of
I ¼ 1.02 Â 10
11 W/cm
2
. (b) Carbon–carbon bond length in red and torsion angle in blue as a
function of the time delay τ. Nuclear motion is modeled classically with an initial temperature of
300 K. Adapted from Crawford-Uranga et al. [100]
264
A.H. Larsen et al.
M ^
U Δt
ð Þ
Ψ A t
ð Þ
¼ M r
ð Þ r ^
U Δt
ð Þ
Ψ A t
ð Þ
r ^
M ^
U v Δt
ð Þ
Ψ B t
ð Þ
¼ 0
k 1 À ^
M
Â
à ^
U Δt
ð Þ
Ψ A t
ð Þ
¼
ð
k
r
1 À M r
ð Þ
½
r ^
U Δt
ð Þ
Ψ A t
ð Þ
dr
k 1 À ^
M
Â
à ^
U v Δt
ð Þ
Ψ B t
ð Þ
¼ k ^
U v Δt
ð Þ
Ψ B t
ð Þ
8
> > > > <
> > > > :
: ð97Þ
Together with (91), it defines a modified scheme completely equivalent to the
previous one in the limit where r s is big enough to justify the outgoing flow
condition. The distance at which this condition is satisfied ultimately depends on
the electron dynamics induced by the external fields.
In (97) the first two equations, which govern the evolution of the real-space
components of the wavefunction in A, are no longer connected with the momentumspace ones, and the propagation is thus equivalent to a time propagation with a
mask function absorber similar to that in (66). The new more stable scheme thus
comes at the price of introducing spurious reflections. Such reflections can, in
principle, be reduced by using the most appropriate MFA or a CAP connected via
equation (67). In the energy range where the MFA is absorbing, it is possible to
carry out stable simulations for long times. As an example, in Fig. 16 we show the
time-resolved photoelectron spectrum for an ethylene molecule where the ionic
degrees of freedom are included at a classical level [100].
5
9
1 3
τ p
τ m
τ (fs)
1
2
Energy (Ha)
2.4
2.5
2.6
2.7
2.8
2.9
C-C bond length (a
0
)
10
-4
10
-3
P(E,τ)
0
10
20
30
40
50
60
Torsion angle (°)
σ x
*
σ
π z
*
π z
π y
*
π y
σ
5
9
1 3
τ p
τ m
τ (fs)
a
b
Fig. 16 Relaxation of a π z ! π
*
z excitation in ethylene observed with photoelectrons calculated
with (91) and (97). (a) Time-resolved photoelectron spectrum P(E, τ) as a function of electron
energy E and time delay τ from the initial excitation measured with an XUV probe pulse of energy
ω ¼ 1.8 a.u., with a 40-cycle trapezoidal shape (8-cycle ramp), and an intensity of
I ¼ 1.02 Â 10
11 W/cm
2
. (b) Carbon–carbon bond length in red and torsion angle in blue as a
function of the time delay τ. Nuclear motion is modeled classically with an initial temperature of
300 K. Adapted from Crawford-Uranga et al. [100]
264
A.H. Larsen et al.