

number formally supposed to lie within 0 θ π/4, although this depends on the
analyticity of the potential. The scaling operation transforms the position and
momentum operators as x ! xe
iθ and d/dx ! e
Àiθ d/dx, wherefore the Hamiltonian
transforms to
^
H θ ψ θ r
ð Þ ¼ ε θ ψ θ r
ð Þ
ð5Þ
with
^
H θ ¼ ^
R θ ^
H ^
R
À1
θ ¼ À
1
2
e
Ài2θ
∇
2
þ v re
iθ
À Á :
ð6Þ
The transformation maps the potential to its analytic continuation on re
iθ in the
complex plane. The interesting property of H ˆ θ is how its spectrum and eigenstates
are related to that of H ˆ . First of all, H ˆ θ is non-Hermitian and therefore admits
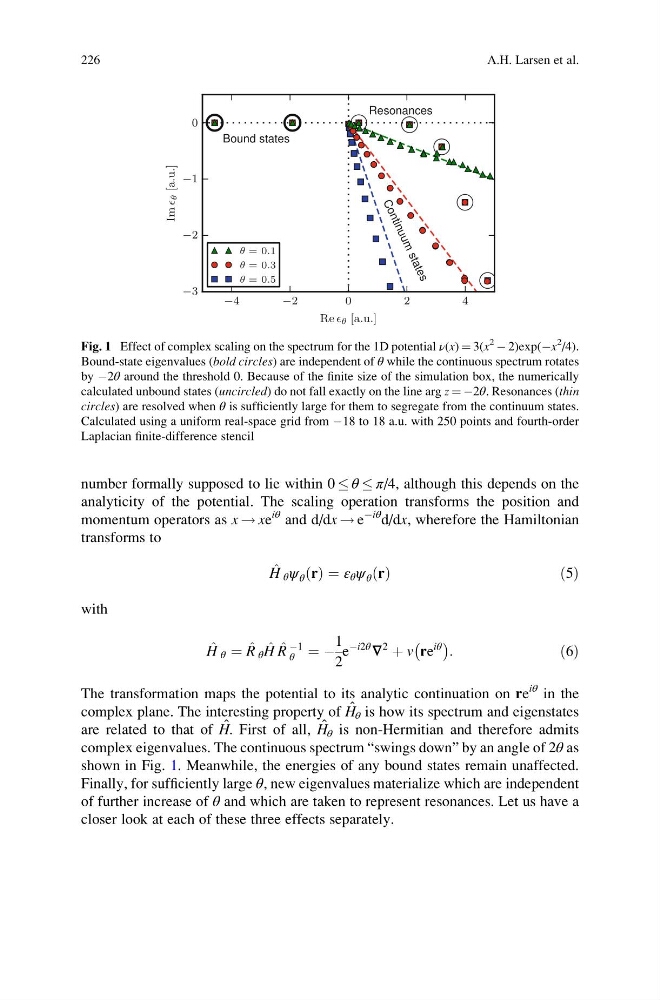
complex eigenvalues. The continuous spectrum “swings down” by an angle of 2θ as
shown in Fig. 1. Meanwhile, the energies of any bound states remain unaffected.
Finally, for sufficiently large θ, new eigenvalues materialize which are independent
of further increase of θ and which are taken to represent resonances. Let us have a
closer look at each of these three effects separately.
−4
−2
0
2
4
Re θ [a.u.]
−3
−2
−1
0
Im
θ [a.u.]
Bound states
C o n ti n u u m s ta te s
Resonances
θ = 0.1
θ = 0.3
θ = 0.5
Fig. 1 Effect of complex scaling on the spectrum for the 1D potential ν(x) ¼ 3(x
2 À 2)exp(Àx
2
/4).
Bound-state eigenvalues (bold circles) are independent of θ while the continuous spectrum rotates
by À2θ around the threshold 0. Because of the finite size of the simulation box, the numerically
calculated unbound states (uncircled) do not fall exactly on the line arg z ¼ À2θ. Resonances (thin
circles) are resolved when θ is sufficiently large for them to segregate from the continuum states.
Calculated using a uniform real-space grid from À18 to 18 a.u. with 250 points and fourth-order
Laplacian finite-difference stencil
226
A.H. Larsen et al.
analyticity of the potential. The scaling operation transforms the position and
momentum operators as x ! xe
iθ and d/dx ! e
Àiθ d/dx, wherefore the Hamiltonian
transforms to
^
H θ ψ θ r
ð Þ ¼ ε θ ψ θ r
ð Þ
ð5Þ
with
^
H θ ¼ ^
R θ ^
H ^
R
À1
θ ¼ À
1
2
e
Ài2θ
∇
2
þ v re
iθ
À Á :
ð6Þ
The transformation maps the potential to its analytic continuation on re
iθ in the
complex plane. The interesting property of H ˆ θ is how its spectrum and eigenstates
are related to that of H ˆ . First of all, H ˆ θ is non-Hermitian and therefore admits
complex eigenvalues. The continuous spectrum “swings down” by an angle of 2θ as
shown in Fig. 1. Meanwhile, the energies of any bound states remain unaffected.
Finally, for sufficiently large θ, new eigenvalues materialize which are independent
of further increase of θ and which are taken to represent resonances. Let us have a
closer look at each of these three effects separately.
−4
−2
0
2
4
Re θ [a.u.]
−3
−2
−1
0
Im
θ [a.u.]
Bound states
C o n ti n u u m s ta te s
Resonances
θ = 0.1
θ = 0.3
θ = 0.5
Fig. 1 Effect of complex scaling on the spectrum for the 1D potential ν(x) ¼ 3(x
2 À 2)exp(Àx
2
/4).
Bound-state eigenvalues (bold circles) are independent of θ while the continuous spectrum rotates
by À2θ around the threshold 0. Because of the finite size of the simulation box, the numerically
calculated unbound states (uncircled) do not fall exactly on the line arg z ¼ À2θ. Resonances (thin
circles) are resolved when θ is sufficiently large for them to segregate from the continuum states.
Calculated using a uniform real-space grid from À18 to 18 a.u. with 250 points and fourth-order
Laplacian finite-difference stencil
226
A.H. Larsen et al.