

making up the case studies. The process design will include a material balance and a
firm process flow sheet. Sufficient data will be generated for all equipment to allow
manufacturers to give a good and realistic equipment budget cost. Where applicable
too, the manufacturers will be requested to provide equipment efficiencies from
which utility usage for the various items can be calculated. Where options exist
within the process design itself, these will be optimized for equipment sizing and
layout. An example of such an optimization is the case of the process heat exchange
system. Full and complete equipment data sheets need not necessarily be developed
for this part of the study. Usually, manufacturers are able to provide good budget
costs from equipment summary sheets similar to those given in the example
calculation below.
Where licensed processes are included in the case study, the development
engineer will need to develop a specification to a suitable licensor soliciting:
• A budget estimate for the plant (installed)
• The utility requirements and the operating cost.
(Note: In the case of a catalytic process, part of the operating cost will be the
catalyst usage or loss in operation.)
• First inventory of catalyst or chemicals where applicable
• The licensing fee
The specification must include the capacity of the plant and the required product
quality. It must also of course give the licensor(s) details of the feedstock, utilities
conditions, and in most cases local climatic conditions. The additional information
concerning feed and product pricing together with utility costs will enable the
licensor to respond with a firmer and optimized cost data.
The following example follows the study screening given in Item 2.0 above.
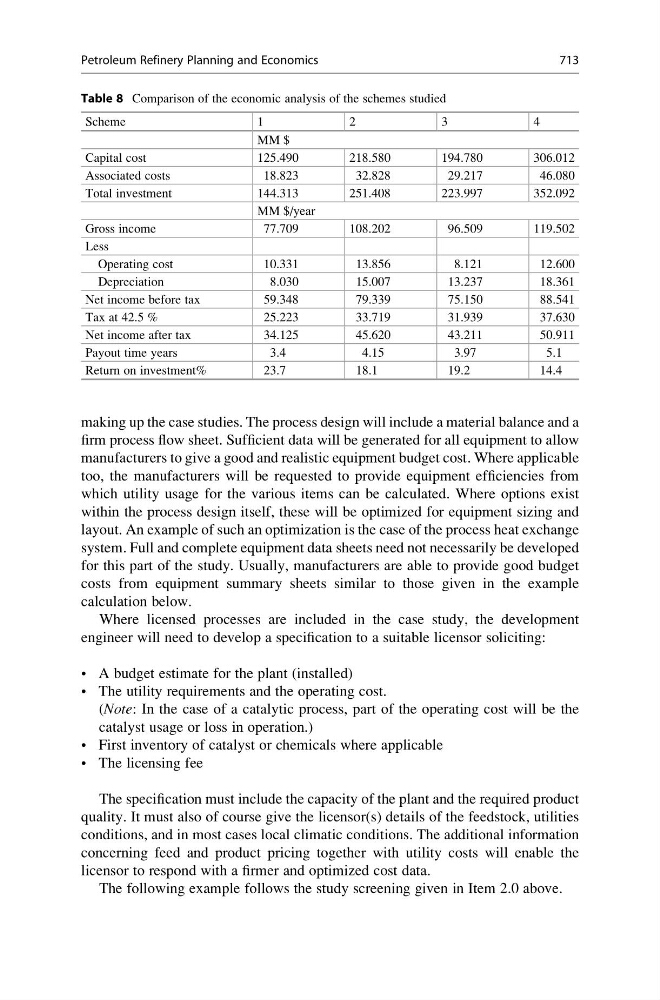
Table 8 Comparison of the economic analysis of the schemes studied
Scheme
1
2
3
4
MM $
Capital cost
125.490
218.580
194.780
306.012
Associated costs
18.823
32.828
29.217
46.080
Total investment
144.313
251.408
223.997
352.092
MM $/year
Gross income
77.709
108.202
96.509
119.502
Less
Operating cost
10.331
13.856
8.121
12.600
Depreciation
8.030
15.007
13.237
18.361
Net income before tax
59.348
79.339
75.150
88.541
Tax at 42.5 %
25.223
33.719
31.939
37.630
Net income after tax
34.125
45.620
43.211
50.911
Payout time years
3.4
4.15
3.97
5.1
Return on investment%
23.7
18.1
19.2
14.4
Petroleum Refinery Planning and Economics
713