

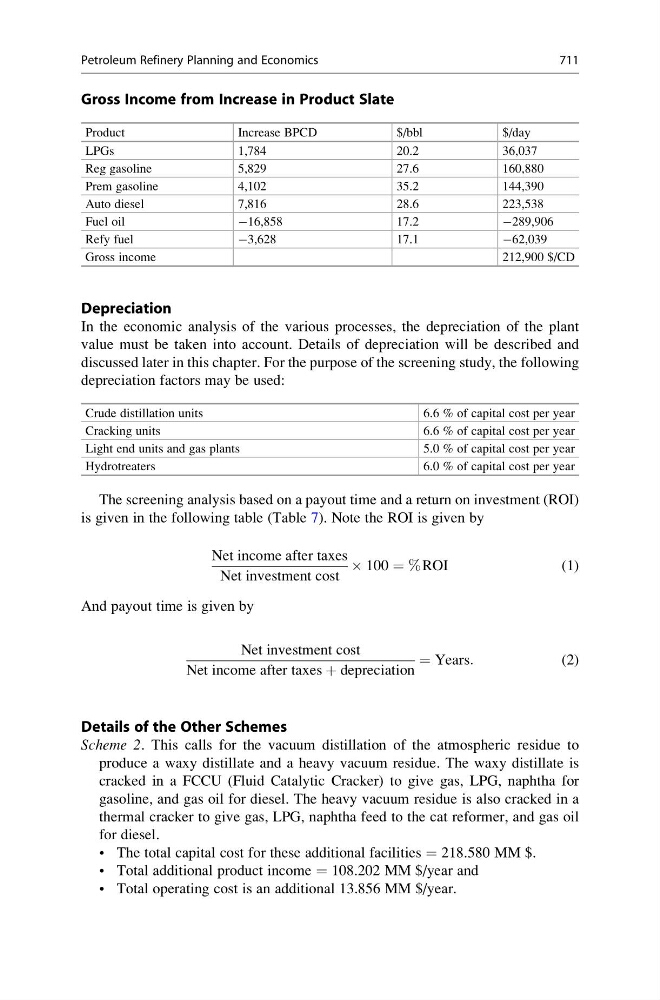
Gross Income from Increase in Product Slate
Product
Increase BPCD
$/bbl
$/day
LPGs
1,784
20.2
36,037
Reg gasoline
5,829
27.6
160,880
Prem gasoline
4,102
35.2
144,390
Auto diesel
7,816
28.6
223,538
Fuel oil
À16,858
17.2
À289,906
Refy fuel
À3,628
17.1
À62,039
Gross income
212,900 $/CD
Depreciation
In the economic analysis of the various processes, the depreciation of the plant
value must be taken into account. Details of depreciation will be described and
discussed later in this chapter. For the purpose of the screening study, the following
depreciation factors may be used:
Crude distillation units
6.6 % of capital cost per year
Cracking units
6.6 % of capital cost per year
Light end units and gas plants
5.0 % of capital cost per year
Hydrotreaters
6.0 % of capital cost per year
The screening analysis based on a payout time and a return on investment (ROI)
is given in the following table (Table 7). Note the ROI is given by
Net income after taxes
Net investment cost
 100 ¼ % ROI
(1)
And payout time is given by
Net investment cost
Net income after taxes þ depreciation
¼ Years:
(2)
Details of the Other Schemes
Scheme 2. This calls for the vacuum distillation of the atmospheric residue to
produce a waxy distillate and a heavy vacuum residue. The waxy distillate is
cracked in a FCCU (Fluid Catalytic Cracker) to give gas, LPG, naphtha for
gasoline, and gas oil for diesel. The heavy vacuum residue is also cracked in a
thermal cracker to give gas, LPG, naphtha feed to the cat reformer, and gas oil
for diesel.
• The total capital cost for these additional facilities = 218.580 MM $.
• Total additional product income = 108.202 MM $/year and
• Total operating cost is an additional 13.856 MM $/year.
Petroleum Refinery Planning and Economics
711