

focused on the tube. A laser sight may be used. Equations are used to correct the
reading for background and reflected radiation. Still, the resulting tube wall
temperature measurements are probably not accurate to more than +/À 50–100
F.
There are techniques available, such as the “gold cup measurement method,”
which directly measure tube wall temperature by contact. These can be used to
verify other readings or to calibrate readings.
Some refiners routinely take infrared photos of their tubes to monitor issues and
trends. This is a good approach for trending, but, from experience, these photos
seem to indicate higher temperatures than other methods.
• Reformer pressure drop
Pressure drop in the reformer tubes is one of the best and simplest methods to
track catalyst coke buildup and catalyst crushing. The pressure drop needs to be
normalized for rate.
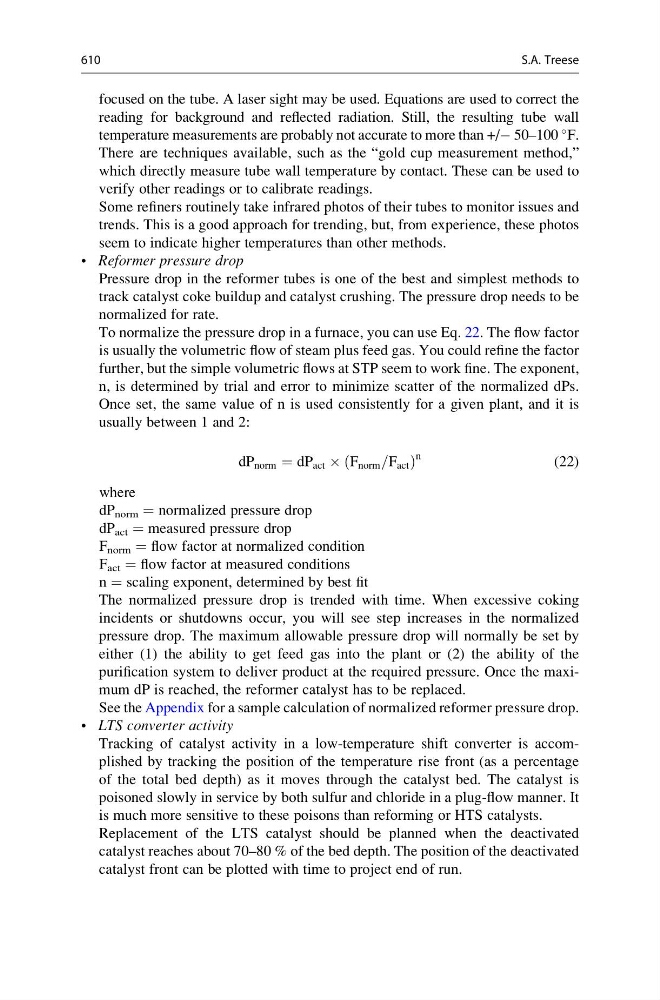
To normalize the pressure drop in a furnace, you can use Eq. 22. The flow factor
is usually the volumetric flow of steam plus feed gas. You could refine the factor
further, but the simple volumetric flows at STP seem to work fine. The exponent,
n, is determined by trial and error to minimize scatter of the normalized dPs.
Once set, the same value of n is used consistently for a given plant, and it is
usually between 1 and 2:
dP norm ¼ dP act  F norm =F act
ð
Þ
n
(22)
where
dP norm = normalized pressure drop
dP act = measured pressure drop
F norm = flow factor at normalized condition
F act = flow factor at measured conditions
n = scaling exponent, determined by best fit
The normalized pressure drop is trended with time. When excessive coking
incidents or shutdowns occur, you will see step increases in the normalized
pressure drop. The maximum allowable pressure drop will normally be set by
either (1) the ability to get feed gas into the plant or (2) the ability of the
purification system to deliver product at the required pressure. Once the maximum dP is reached, the reformer catalyst has to be replaced.
See the Appendix for a sample calculation of normalized reformer pressure drop.
• LTS converter activity
Tracking of catalyst activity in a low-temperature shift converter is accomplished by tracking the position of the temperature rise front (as a percentage
of the total bed depth) as it moves through the catalyst bed. The catalyst is
poisoned slowly in service by both sulfur and chloride in a plug-flow manner. It
is much more sensitive to these poisons than reforming or HTS catalysts.
Replacement of the LTS catalyst should be planned when the deactivated
catalyst reaches about 70–80 % of the bed depth. The position of the deactivated
catalyst front can be plotted with time to project end of run.
610
S.A. Treese