

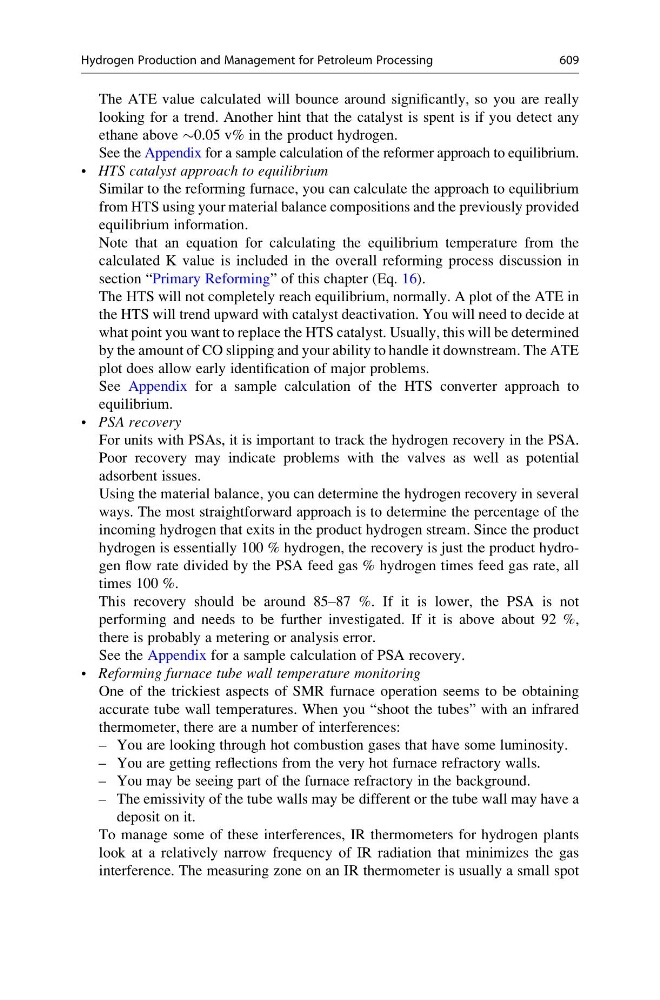
The ATE value calculated will bounce around significantly, so you are really
looking for a trend. Another hint that the catalyst is spent is if you detect any
ethane above $0.05 v% in the product hydrogen.
See the Appendix for a sample calculation of the reformer approach to equilibrium.
• HTS catalyst approach to equilibrium
Similar to the reforming furnace, you can calculate the approach to equilibrium
from HTS using your material balance compositions and the previously provided
equilibrium information.
Note that an equation for calculating the equilibrium temperature from the
calculated K value is included in the overall reforming process discussion in
section “Primary Reforming” of this chapter (Eq. 16).
The HTS will not completely reach equilibrium, normally. A plot of the ATE in
the HTS will trend upward with catalyst deactivation. You will need to decide at
what point you want to replace the HTS catalyst. Usually, this will be determined
by the amount of CO slipping and your ability to handle it downstream. The ATE
plot does allow early identification of major problems.
See Appendix for a sample calculation of the HTS converter approach to
equilibrium.
• PSA recovery
For units with PSAs, it is important to track the hydrogen recovery in the PSA.
Poor recovery may indicate problems with the valves as well as potential
adsorbent issues.
Using the material balance, you can determine the hydrogen recovery in several
ways. The most straightforward approach is to determine the percentage of the
incoming hydrogen that exits in the product hydrogen stream. Since the product
hydrogen is essentially 100 % hydrogen, the recovery is just the product hydrogen flow rate divided by the PSA feed gas % hydrogen times feed gas rate, all
times 100 %.
This recovery should be around 85–87 %. If it is lower, the PSA is not
performing and needs to be further investigated. If it is above about 92 %,
there is probably a metering or analysis error.
See the Appendix for a sample calculation of PSA recovery.
• Reforming furnace tube wall temperature monitoring
One of the trickiest aspects of SMR furnace operation seems to be obtaining
accurate tube wall temperatures. When you “shoot the tubes” with an infrared
thermometer, there are a number of interferences:
– You are looking through hot combustion gases that have some luminosity.
– You are getting reflections from the very hot furnace refractory walls.
– You may be seeing part of the furnace refractory in the background.
– The emissivity of the tube walls may be different or the tube wall may have a
deposit on it.
To manage some of these interferences, IR thermometers for hydrogen plants
look at a relatively narrow frequency of IR radiation that minimizes the gas
interference. The measuring zone on an IR thermometer is usually a small spot
Hydrogen Production and Management for Petroleum Processing
609