

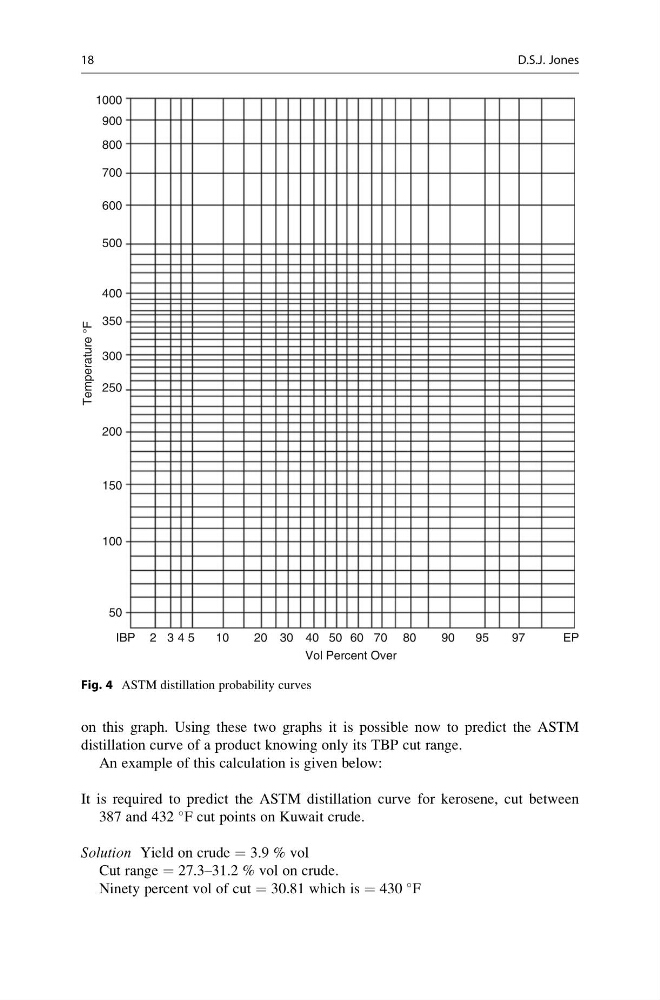
on this graph. Using these two graphs it is possible now to predict the ASTM
distillation curve of a product knowing only its TBP cut range.
An example of this calculation is given below:
It is required to predict the ASTM distillation curve for kerosene, cut between
387 and 432
F cut points on Kuwait crude.
Solution Yield on crude = 3.9 % vol
Cut range = 27.3–31.2 % vol on crude.
Ninety percent vol of cut = 30.81 which is = 430
F
1000
900
800
700
600
500
400
350
Temperature °F
300
250
200
150
100
50
IBP 2 3 4 5
10
20 30 40 50
Vol Percent Over
60 70 80
90
95
97
EP
Fig. 4 ASTM distillation probability curves
18
D.S.J. Jones
distillation curve of a product knowing only its TBP cut range.
An example of this calculation is given below:
It is required to predict the ASTM distillation curve for kerosene, cut between
387 and 432
F cut points on Kuwait crude.
Solution Yield on crude = 3.9 % vol
Cut range = 27.3–31.2 % vol on crude.
Ninety percent vol of cut = 30.81 which is = 430
F
1000
900
800
700
600
500
400
350
Temperature °F
300
250
200
150
100
50
IBP 2 3 4 5
10
20 30 40 50
Vol Percent Over
60 70 80
90
95
97
EP
Fig. 4 ASTM distillation probability curves
18
D.S.J. Jones