

These assigned properties are obtained either from the assay data, known
components of similar boiling points, or established relationships such as gravity,
molecular weights, and boiling points. However, before these mid-boiling points
(pseudo) components can be developed, it is necessary to know the shape of the
product TBP curve. The following is a method by which this can be achieved. Good
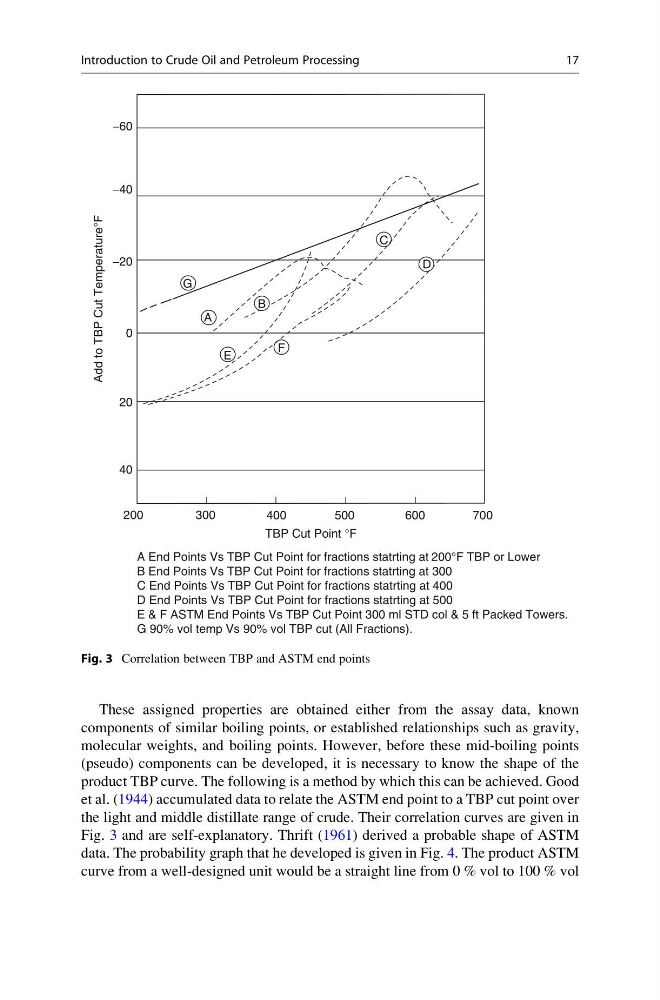
et al. (1944) accumulated data to relate the ASTM end point to a TBP cut point over
the light and middle distillate range of crude. Their correlation curves are given in
Fig. 3 and are self-explanatory. Thrift (1961) derived a probable shape of ASTM
data. The probability graph that he developed is given in Fig. 4. The product ASTM
curve from a well-designed unit would be a straight line from 0 % vol to 100 % vol
A End Points Vs TBP Cut Point for fractions statrting at 200°F TBP or Lower
B End Points Vs TBP Cut Point for fractions statrting at 300
C End Points Vs TBP Cut Point for fractions statrting at 400
D End Points Vs TBP Cut Point for fractions statrting at 500
E & F ASTM End Points Vs TBP Cut Point 300 ml STD col & 5 ft Packed Towers.
G 90% vol temp Vs 90% vol TBP cut (All Fractions).
−60
−40
−20
20
40
200
300
400
TBP Cut Point °F
500
600
700
0
Add to TBP Cut Temperature°F
G
A
B
E
F
C
D
Fig. 3 Correlation between TBP and ASTM end points
Introduction to Crude Oil and Petroleum Processing
17
components of similar boiling points, or established relationships such as gravity,
molecular weights, and boiling points. However, before these mid-boiling points
(pseudo) components can be developed, it is necessary to know the shape of the
product TBP curve. The following is a method by which this can be achieved. Good
et al. (1944) accumulated data to relate the ASTM end point to a TBP cut point over
the light and middle distillate range of crude. Their correlation curves are given in
Fig. 3 and are self-explanatory. Thrift (1961) derived a probable shape of ASTM
data. The probability graph that he developed is given in Fig. 4. The product ASTM
curve from a well-designed unit would be a straight line from 0 % vol to 100 % vol
A End Points Vs TBP Cut Point for fractions statrting at 200°F TBP or Lower
B End Points Vs TBP Cut Point for fractions statrting at 300
C End Points Vs TBP Cut Point for fractions statrting at 400
D End Points Vs TBP Cut Point for fractions statrting at 500
E & F ASTM End Points Vs TBP Cut Point 300 ml STD col & 5 ft Packed Towers.
G 90% vol temp Vs 90% vol TBP cut (All Fractions).
−60
−40
−20
20
40
200
300
400
TBP Cut Point °F
500
600
700
0
Add to TBP Cut Temperature°F
G
A
B
E
F
C
D
Fig. 3 Correlation between TBP and ASTM end points
Introduction to Crude Oil and Petroleum Processing
17