

transitions from the occupied SP hybrid orbitals to the virtual SP hybrid orbitals.
This can be characterized as an intraband transition and is consistent with a classical
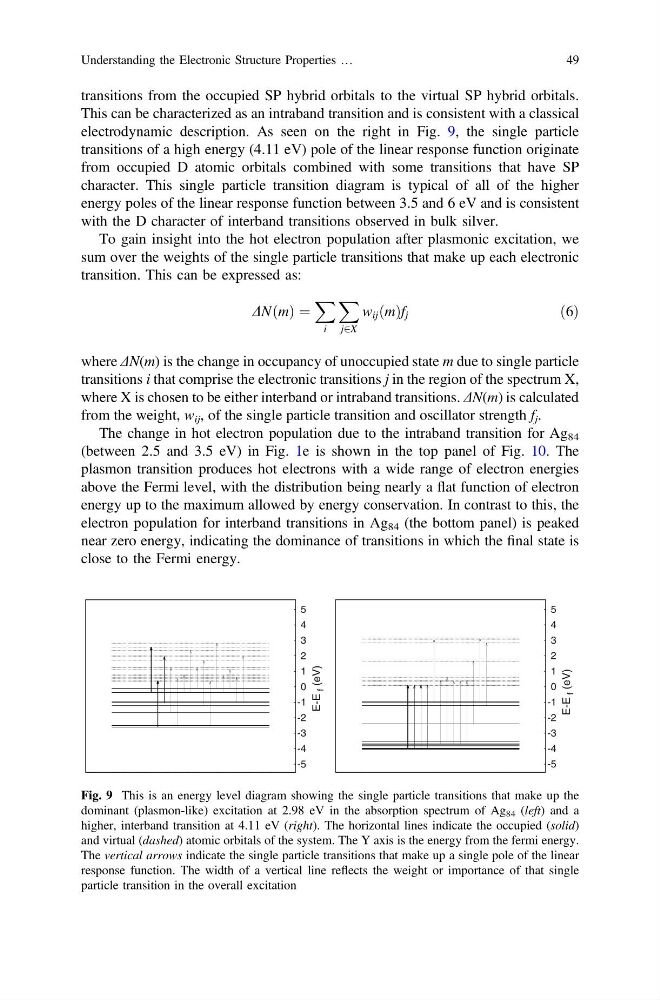
electrodynamic description. As seen on the right in Fig. 9, the single particle
transitions of a high energy (4.11 eV) pole of the linear response function originate
from occupied D atomic orbitals combined with some transitions that have SP
character. This single particle transition diagram is typical of all of the higher
energy poles of the linear response function between 3.5 and 6 eV and is consistent
with the D character of interband transitions observed in bulk silver.
To gain insight into the hot electron population after plasmonic excitation, we
sum over the weights of the single particle transitions that make up each electronic
transition. This can be expressed as:
DNðmÞ ¼
X
i
X
j2X
w ij ðmÞf j
ð6Þ
where ΔN(m) is the change in occupancy of unoccupied state m due to single particle
transitions i that comprise the electronic transitions j in the region of the spectrum X,
where X is chosen to be either interband or intraband transitions. ΔN(m) is calculated
from the weight, w ij , of the single particle transition and oscillator strength f j .
The change in hot electron population due to the intraband transition for Ag 84
(between 2.5 and 3.5 eV) in Fig. 1e is shown in the top panel of Fig. 10. The
plasmon transition produces hot electrons with a wide range of electron energies
above the Fermi level, with the distribution being nearly a flat function of electron
energy up to the maximum allowed by energy conservation. In contrast to this, the
electron population for interband transitions in Ag 84 (the bottom panel) is peaked
near zero energy, indicating the dominance of transitions in which the final state is
close to the Fermi energy.
-5
-4
-3
-2
-1
0
1
2
3
4
5
-5
-4
-3
-2
-1
0
1
2
3
4
5
E-E
f (eV)
E-E
f (eV)
Fig. 9 This is an energy level diagram showing the single particle transitions that make up the
dominant (plasmon-like) excitation at 2.98 eV in the absorption spectrum of Ag 84 (left) and a
higher, interband transition at 4.11 eV (right). The horizontal lines indicate the occupied (solid)
and virtual (dashed) atomic orbitals of the system. The Y axis is the energy from the fermi energy.
The vertical arrows indicate the single particle transitions that make up a single pole of the linear
response function. The width of a vertical line reflects the weight or importance of that single
particle transition in the overall excitation
Understanding the Electronic Structure Properties …
49
This can be characterized as an intraband transition and is consistent with a classical
electrodynamic description. As seen on the right in Fig. 9, the single particle
transitions of a high energy (4.11 eV) pole of the linear response function originate
from occupied D atomic orbitals combined with some transitions that have SP
character. This single particle transition diagram is typical of all of the higher
energy poles of the linear response function between 3.5 and 6 eV and is consistent
with the D character of interband transitions observed in bulk silver.
To gain insight into the hot electron population after plasmonic excitation, we
sum over the weights of the single particle transitions that make up each electronic
transition. This can be expressed as:
DNðmÞ ¼
X
i
X
j2X
w ij ðmÞf j
ð6Þ
where ΔN(m) is the change in occupancy of unoccupied state m due to single particle
transitions i that comprise the electronic transitions j in the region of the spectrum X,
where X is chosen to be either interband or intraband transitions. ΔN(m) is calculated
from the weight, w ij , of the single particle transition and oscillator strength f j .
The change in hot electron population due to the intraband transition for Ag 84
(between 2.5 and 3.5 eV) in Fig. 1e is shown in the top panel of Fig. 10. The
plasmon transition produces hot electrons with a wide range of electron energies
above the Fermi level, with the distribution being nearly a flat function of electron
energy up to the maximum allowed by energy conservation. In contrast to this, the
electron population for interband transitions in Ag 84 (the bottom panel) is peaked
near zero energy, indicating the dominance of transitions in which the final state is
close to the Fermi energy.
-5
-4
-3
-2
-1
0
1
2
3
4
5
-5
-4
-3
-2
-1
0
1
2
3
4
5
E-E
f (eV)
E-E
f (eV)
Fig. 9 This is an energy level diagram showing the single particle transitions that make up the
dominant (plasmon-like) excitation at 2.98 eV in the absorption spectrum of Ag 84 (left) and a
higher, interband transition at 4.11 eV (right). The horizontal lines indicate the occupied (solid)
and virtual (dashed) atomic orbitals of the system. The Y axis is the energy from the fermi energy.
The vertical arrows indicate the single particle transitions that make up a single pole of the linear
response function. The width of a vertical line reflects the weight or importance of that single
particle transition in the overall excitation
Understanding the Electronic Structure Properties …
49