

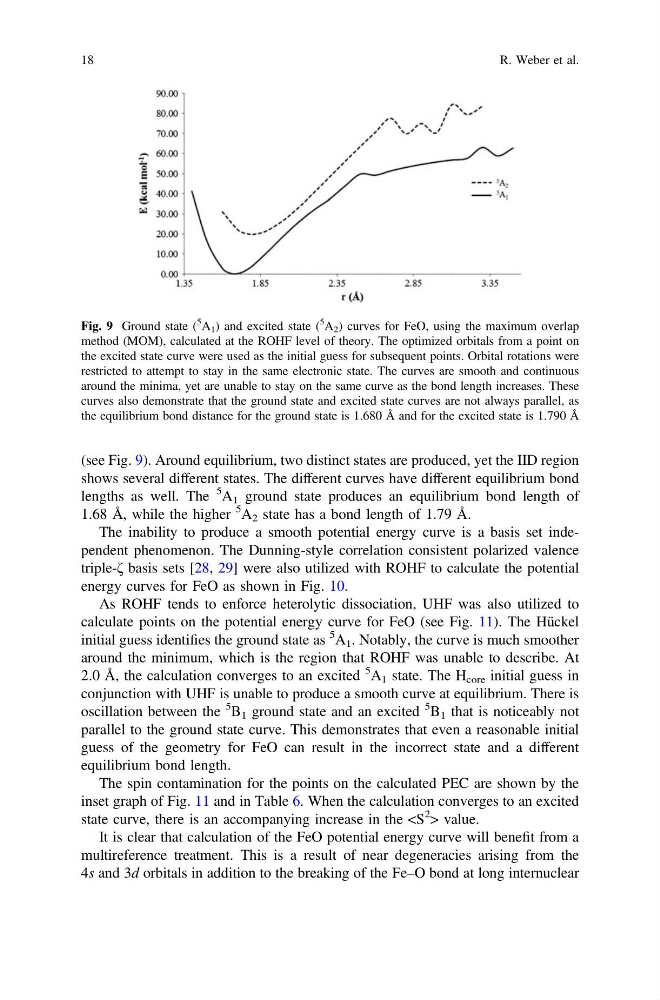
(see Fig. 9). Around equilibrium, two distinct states are produced, yet the IID region
shows several different states. The different curves have different equilibrium bond
lengths as well. The
5
A 1 ground state produces an equilibrium bond length of
1.68 Å, while the higher
5 A 2 state has a bond length of 1.79 Å.
The inability to produce a smooth potential energy curve is a basis set independent phenomenon. The Dunning-style correlation consistent polarized valence
triple-ζ basis sets [28, 29] were also utilized with ROHF to calculate the potential
energy curves for FeO as shown in Fig. 10.
As ROHF tends to enforce heterolytic dissociation, UHF was also utilized to
calculate points on the potential energy curve for FeO (see Fig. 11). The Hückel
initial guess identifies the ground state as
5 A 1 . Notably, the curve is much smoother
around the minimum, which is the region that ROHF was unable to describe. At
2.0 Å, the calculation converges to an excited
5 A 1 state. The H core initial guess in
conjunction with UHF is unable to produce a smooth curve at equilibrium. There is
oscillation between the
5 B 1 ground state and an excited
5 B 1 that is noticeably not
parallel to the ground state curve. This demonstrates that even a reasonable initial
guess of the geometry for FeO can result in the incorrect state and a different
equilibrium bond length.
The spin contamination for the points on the calculated PEC are shown by the
inset graph of Fig. 11 and in Table 6. When the calculation converges to an excited
state curve, there is an accompanying increase in the
It is clear that calculation of the FeO potential energy curve will benefit from a
multireference treatment. This is a result of near degeneracies arising from the
4s and 3d orbitals in addition to the breaking of the Fe–O bond at long internuclear
Fig. 9 Ground state (
5
A 1 ) and excited state (
5
A 2 ) curves for FeO, using the maximum overlap
method (MOM), calculated at the ROHF level of theory. The optimized orbitals from a point on
the excited state curve were used as the initial guess for subsequent points. Orbital rotations were
restricted to attempt to stay in the same electronic state. The curves are smooth and continuous
around the minima, yet are unable to stay on the same curve as the bond length increases. These
curves also demonstrate that the ground state and excited state curves are not always parallel, as
the equilibrium bond distance for the ground state is 1.680 Å and for the excited state is 1.790 Å
18
R. Weber et al.
shows several different states. The different curves have different equilibrium bond
lengths as well. The
5
A 1 ground state produces an equilibrium bond length of
1.68 Å, while the higher
5 A 2 state has a bond length of 1.79 Å.
The inability to produce a smooth potential energy curve is a basis set independent phenomenon. The Dunning-style correlation consistent polarized valence
triple-ζ basis sets [28, 29] were also utilized with ROHF to calculate the potential
energy curves for FeO as shown in Fig. 10.
As ROHF tends to enforce heterolytic dissociation, UHF was also utilized to
calculate points on the potential energy curve for FeO (see Fig. 11). The Hückel
initial guess identifies the ground state as
5 A 1 . Notably, the curve is much smoother
around the minimum, which is the region that ROHF was unable to describe. At
2.0 Å, the calculation converges to an excited
5 A 1 state. The H core initial guess in
conjunction with UHF is unable to produce a smooth curve at equilibrium. There is
oscillation between the
5 B 1 ground state and an excited
5 B 1 that is noticeably not
parallel to the ground state curve. This demonstrates that even a reasonable initial
guess of the geometry for FeO can result in the incorrect state and a different
equilibrium bond length.
The spin contamination for the points on the calculated PEC are shown by the
inset graph of Fig. 11 and in Table 6. When the calculation converges to an excited
state curve, there is an accompanying increase in the
It is clear that calculation of the FeO potential energy curve will benefit from a
multireference treatment. This is a result of near degeneracies arising from the
4s and 3d orbitals in addition to the breaking of the Fe–O bond at long internuclear
Fig. 9 Ground state (
5
A 1 ) and excited state (
5
A 2 ) curves for FeO, using the maximum overlap
method (MOM), calculated at the ROHF level of theory. The optimized orbitals from a point on
the excited state curve were used as the initial guess for subsequent points. Orbital rotations were
restricted to attempt to stay in the same electronic state. The curves are smooth and continuous
around the minima, yet are unable to stay on the same curve as the bond length increases. These
curves also demonstrate that the ground state and excited state curves are not always parallel, as
the equilibrium bond distance for the ground state is 1.680 Å and for the excited state is 1.790 Å
18
R. Weber et al.