

and Hückel guesses producing the same smooth PECs. MgO and CaO both exhibit
some multireference character throughout the entire potential energy curve as
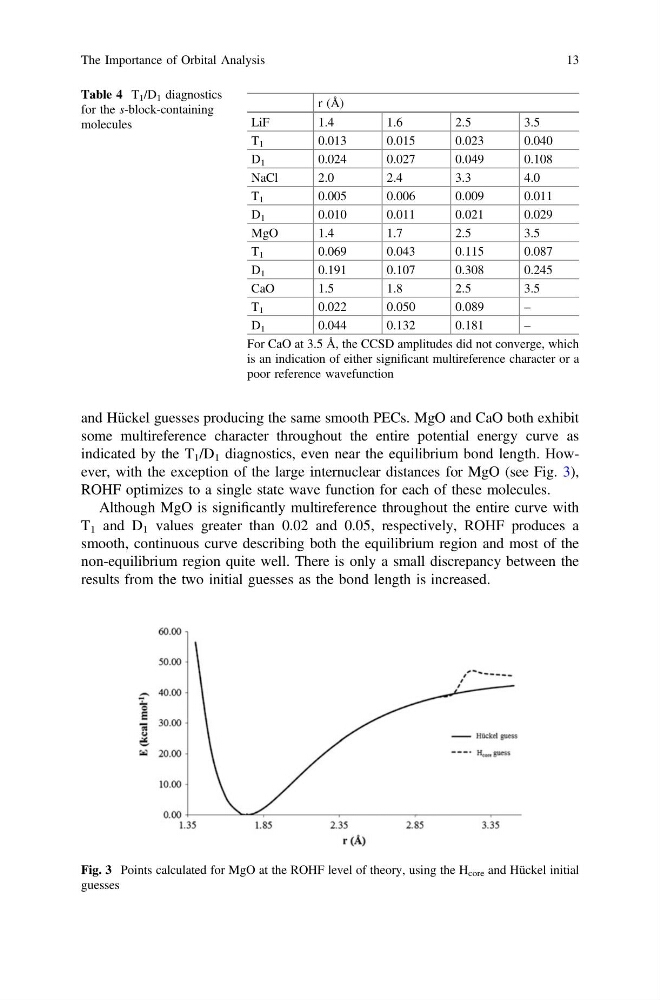
indicated by the T 1 /D 1 diagnostics, even near the equilibrium bond length. However, with the exception of the large internuclear distances for MgO (see Fig. 3),
ROHF optimizes to a single state wave function for each of these molecules.
Although MgO is significantly multireference throughout the entire curve with
T 1 and D 1 values greater than 0.02 and 0.05, respectively, ROHF produces a
smooth, continuous curve describing both the equilibrium region and most of the
non-equilibrium region quite well. There is only a small discrepancy between the
results from the two initial guesses as the bond length is increased.
Table 4 T 1 /D 1 diagnostics
for the s-block-containing
molecules
r (Å)
LiF
1.4
1.6
2.5
3.5
T 1
0.013
0.015
0.023
0.040
D 1
0.024
0.027
0.049
0.108
NaCl
2.0
2.4
3.3
4.0
T 1
0.005
0.006
0.009
0.011
D 1
0.010
0.011
0.021
0.029
MgO
1.4
1.7
2.5
3.5
T 1
0.069
0.043
0.115
0.087
D 1
0.191
0.107
0.308
0.245
CaO
1.5
1.8
2.5
3.5
T 1
0.022
0.050
0.089
–
D 1
0.044
0.132
0.181
–
For CaO at 3.5 Å, the CCSD amplitudes did not converge, which
is an indication of either significant multireference character or a
poor reference wavefunction
Fig. 3 Points calculated for MgO at the ROHF level of theory, using the H core and Hückel initial
guesses
The Importance of Orbital Analysis
13
some multireference character throughout the entire potential energy curve as
indicated by the T 1 /D 1 diagnostics, even near the equilibrium bond length. However, with the exception of the large internuclear distances for MgO (see Fig. 3),
ROHF optimizes to a single state wave function for each of these molecules.
Although MgO is significantly multireference throughout the entire curve with
T 1 and D 1 values greater than 0.02 and 0.05, respectively, ROHF produces a
smooth, continuous curve describing both the equilibrium region and most of the
non-equilibrium region quite well. There is only a small discrepancy between the
results from the two initial guesses as the bond length is increased.
Table 4 T 1 /D 1 diagnostics
for the s-block-containing
molecules
r (Å)
LiF
1.4
1.6
2.5
3.5
T 1
0.013
0.015
0.023
0.040
D 1
0.024
0.027
0.049
0.108
NaCl
2.0
2.4
3.3
4.0
T 1
0.005
0.006
0.009
0.011
D 1
0.010
0.011
0.021
0.029
MgO
1.4
1.7
2.5
3.5
T 1
0.069
0.043
0.115
0.087
D 1
0.191
0.107
0.308
0.245
CaO
1.5
1.8
2.5
3.5
T 1
0.022
0.050
0.089
–
D 1
0.044
0.132
0.181
–
For CaO at 3.5 Å, the CCSD amplitudes did not converge, which
is an indication of either significant multireference character or a
poor reference wavefunction
Fig. 3 Points calculated for MgO at the ROHF level of theory, using the H core and Hückel initial
guesses
The Importance of Orbital Analysis
13